Analysis of compensation, level, and experience details of 19k tech workers
[Twitter thread, Hacker News discussion, Reddit discussion]
There are several metrics important to our career progress: How much should I be paid? How long should it take me to get to the next level? Does my field really favor the young and if so, does my career have a deadline?
Employers know the answers as they have the benefit of seeing an aggregated picture through dealing with many candidates and employees. The majority of us, however, may only work with a handful of employers in our entire life. And when we’re early in our careers, this type of information is a blackbox.
This imbalance of information gives employers more leverage, both during offer negotiations and promotion discussions. Last year, I’ve helped around 20 friends negotiate their offers – most of them for their first jobs. I notice that they all originally aimed for a package lower than what people with their backgrounds should be paid. One notable example is a candidate who told me he would be happy with $120k/year and ended up with an offer of $180k/year.
This imbalance of information especially hurts candidates of underrepresented groups who don’t already know people who can help guide them through the process.
I was glad to see an initiative by levels.fyi to let people share their compensation details anonymously and everyone can see the range of compensation for people at certain levels at certain companies.
Recently, levels.fyi shared with me the data. As far as I know, this is the largest data on compensation and level details of tech workers. I used their dataset as a proxy to answer four questions:
- How long does it take for software engineers to reach a certain level? E.g. how long, on average, does it take for one person to become a senior engineer or a principal engineer?
- How much money do tech workers actually make? How is it different across jobs?
- Do women get paid less than men in tech? This compares the compensation details of people at the same company, same job, same level, same state.
- The tech industry is notorious for favoring the young. Do younger engineers really make more money? What’s the correlation between the number of years of experience and the total yearly compensation?
Disclaimer
- The data is self-reported anonymously, and therefore suffers from all the biases of self-reported, anonymous data.
- Just because there’s no evidence in the data to support something, doesn’t mean that something doesn’t exist.
Table of contents
- Data
- Career progression analysis
- Compensation analysis
- Compensation by gender
1. Data
After some basic cleaning, deduplication, and outlier removal, I get the self-reported compensation details of 18.8k tech workers. Each entry contains:
- compensation details (broken down to base salaries, equity, bonus)
- job
- level
- gender
- years of experience
- years at company
There are 13k samples with gender specified as Female or Male. Of which, 13.27% are female. This is close to a PEW research in 2018 that women make up only 14% of the engineering workforce.
Approximately 80% of these entries come from the US.
- 40% from California
- 24% from Washington
Most popular cities:
Seattle, WA         3119
San Francisco, CA   2331
New York, NY        1133
Redmond, WA         1091
Sunnyvale, CA       877
Mountain View, CA   859
San Jose, CA        648
FAAAM (Facebook, Alphabet/Google, Amazon, Apple, Microsoft) employees make up 40% of the entries.
amazon         2629
microsoft      1971
google         1552
facebook        873
apple           781
65% of the entries are software engineers. 7 most popular jobs account for 88% of all the entries.
software engineer   12405
product manager     1311
swe manager         1125
data scientist      649
hardware engineer   460
product designer    366
solution architect  350
Tech companies have different levels. For example, Google’s levels go from L3 to L10 but Microsoft goes from SDE to Technical Fellow while NVIDIA goes from IC1 to IC9. levels.fyi tried to standardize most levels for software engineering across major companies to 6 levels from Entry Level Engineer to Distinguished Engineer. They didn’t annotate standard levels for entries from smaller companies, because roles at smaller companies are more fluid.
Entry Level Engineer      3526
Software Engineer         3965
Senior Engineer           2795
Staff Engineer             774
Principal Engineer         203
Distinguished Engineer      26
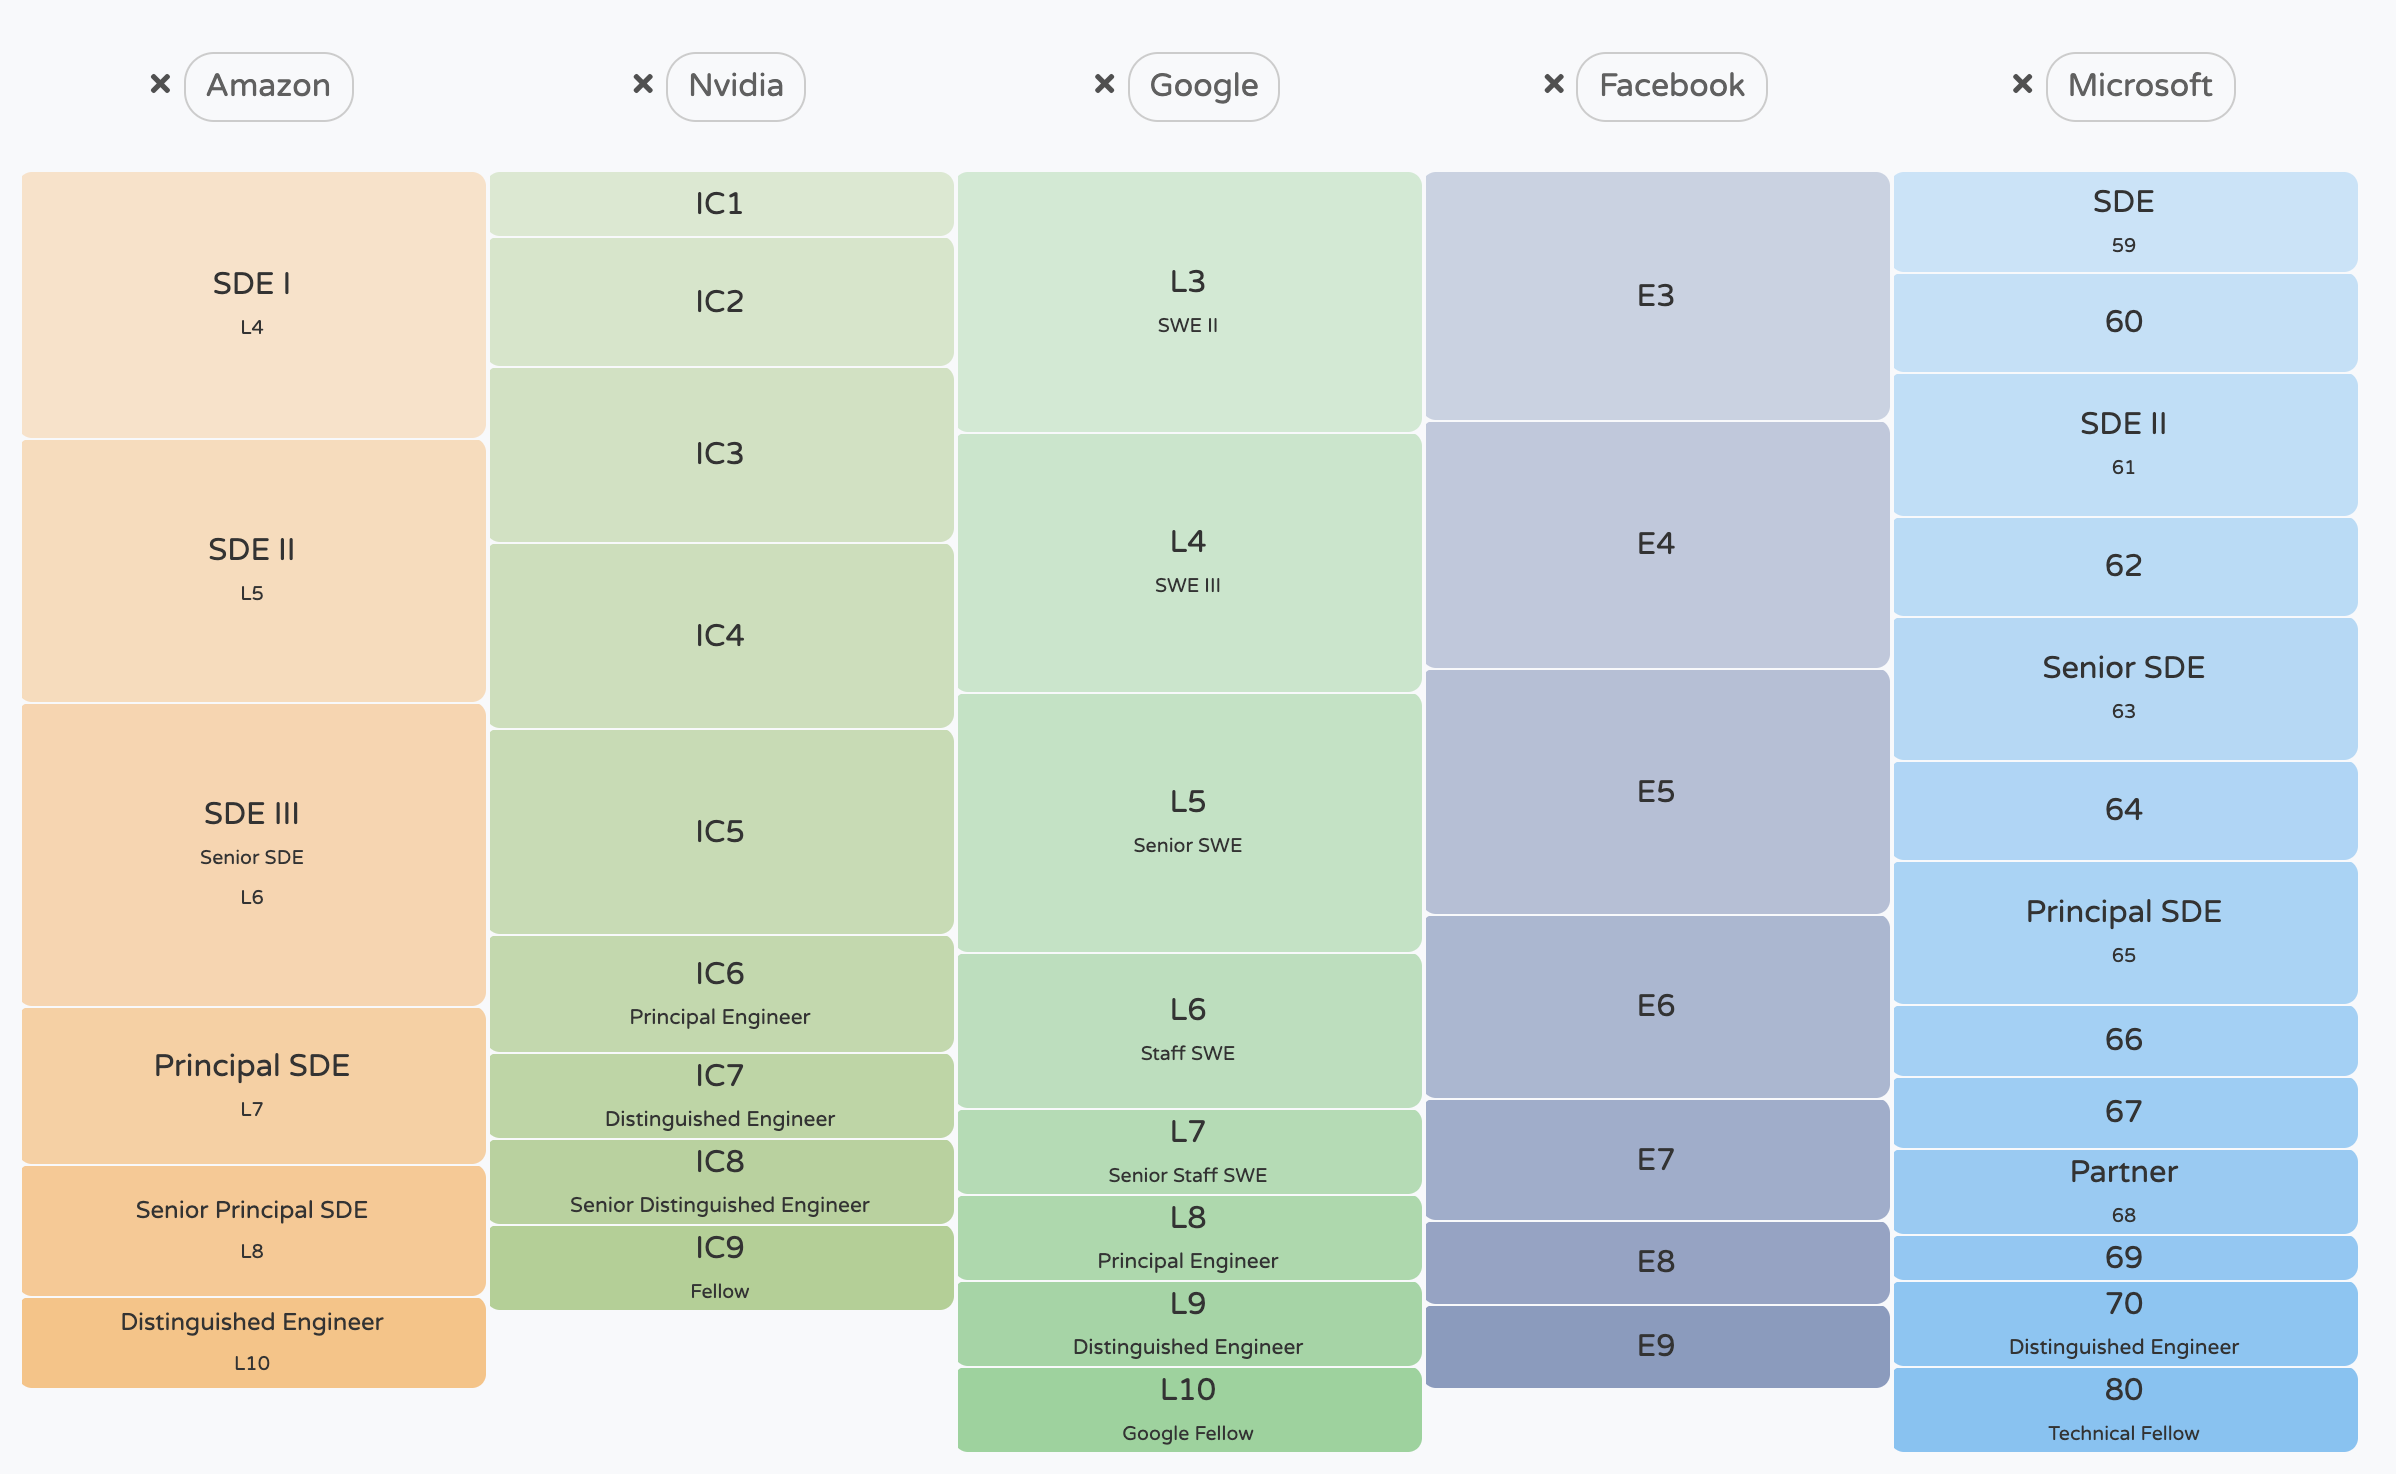
For more details on how these levels compare across companies, visit levels.fyi.
2. Career progression analysis for software engineers
We don’t have the number of years people take to reach a level. What we have is the number of years of experience someone has, and what level they are right now. The number we have is the sum of:
- the number of years it takes for them to reach that level.
- the number of years they have been at that level.
For engineering roles at some companies, after you reach a certain level, it’s very hard to progress to the next level, e.g. it’s hard to progress beyond level SDE III at Amazon or beyond L6 at Google. Some people either stay at the role for a long time, change company, or change careers.
Reporting bias: people tend to round up their number of years of experience to the nearest integer.
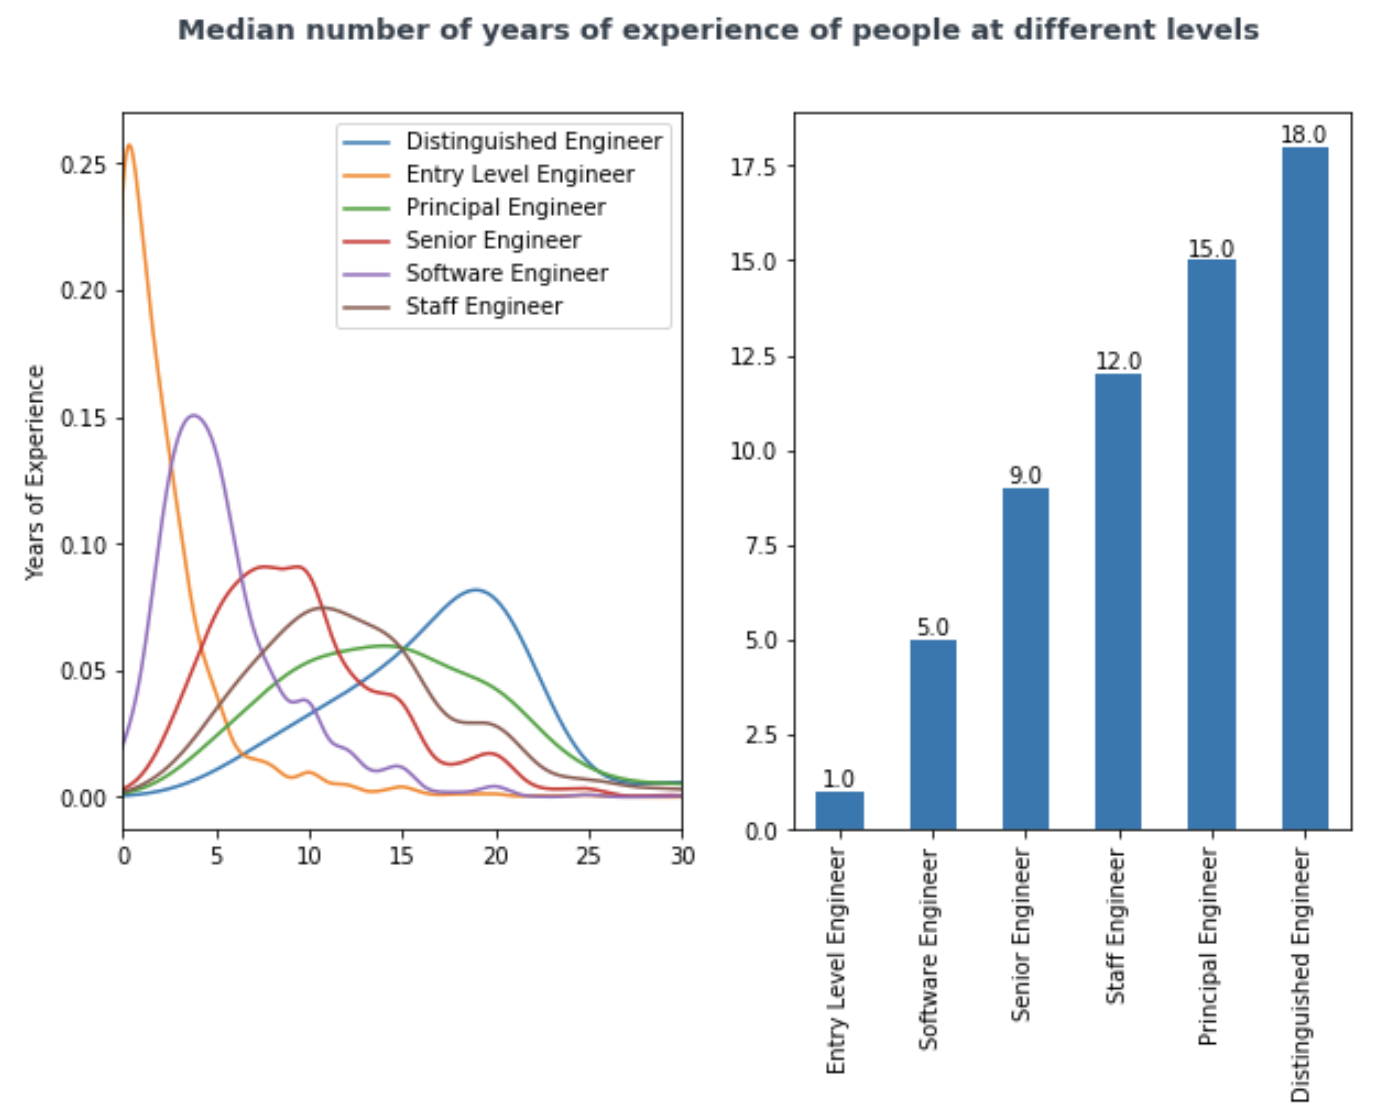
Analysis
- If after graduation, people become an entry level engineer, then on average, it takes 1 year to get out of that entry level position.
- After spending 4 years as a software engineer to become a senior sotware engineer, it takes another 4 years to become a staff engineer.
- It takes, on average, 18 years to become a Distinguished Engineer.
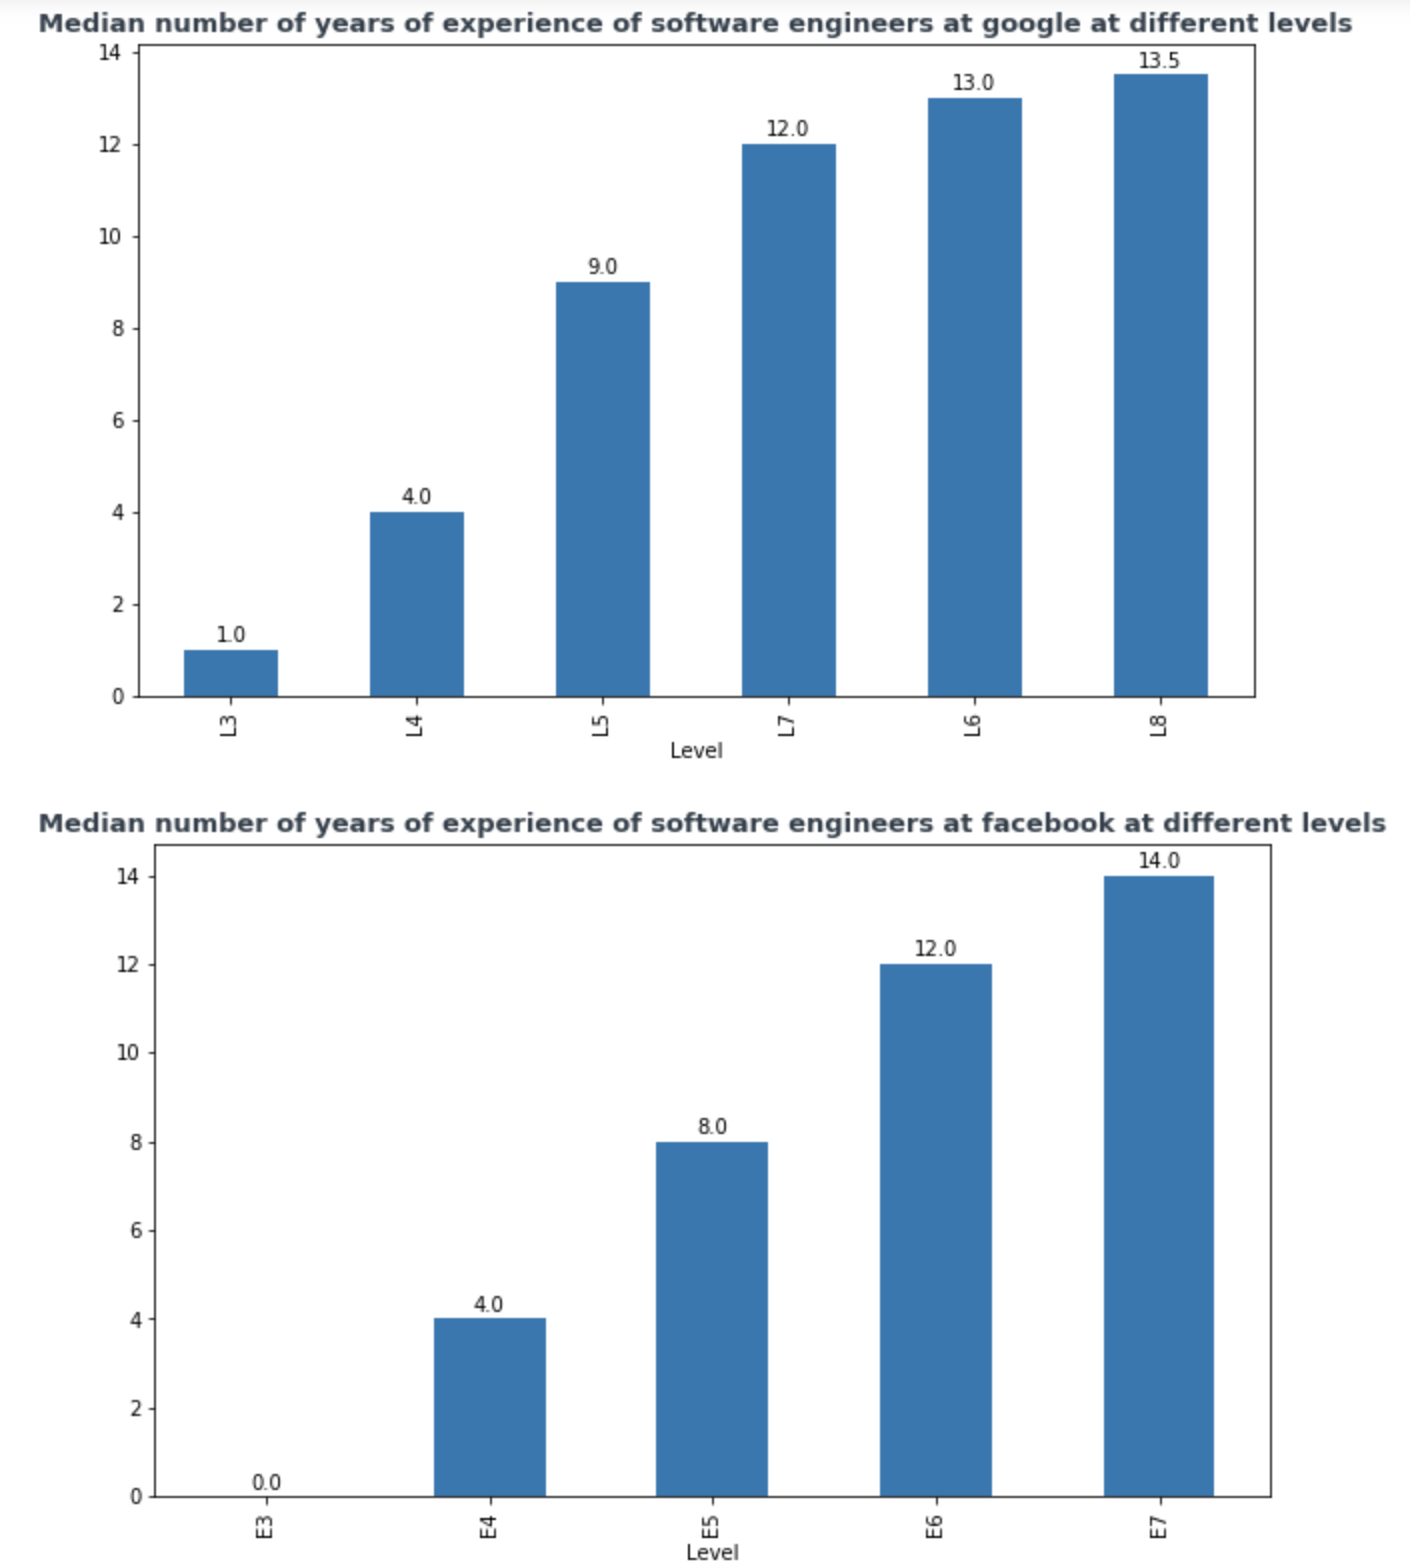
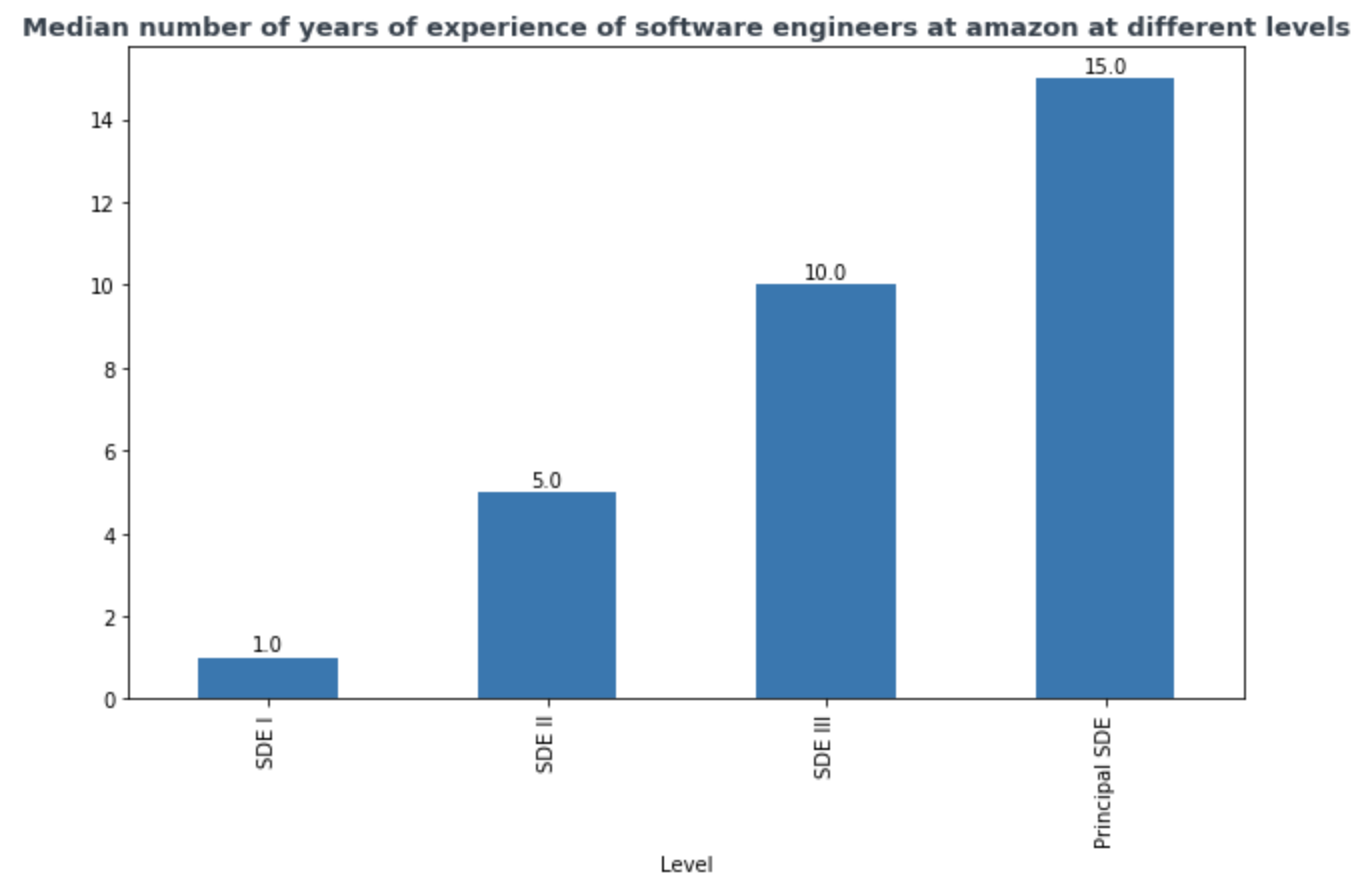
2.1 Career progression at major companies
Let’s look at the time it takes to move from a level to the next at FAAAM companies.
At Google, on average, people at L7 has one year of experience less than people at L6. One theory is that to get to L7 at Google, you have to be really good, and really good people get promoted faster.
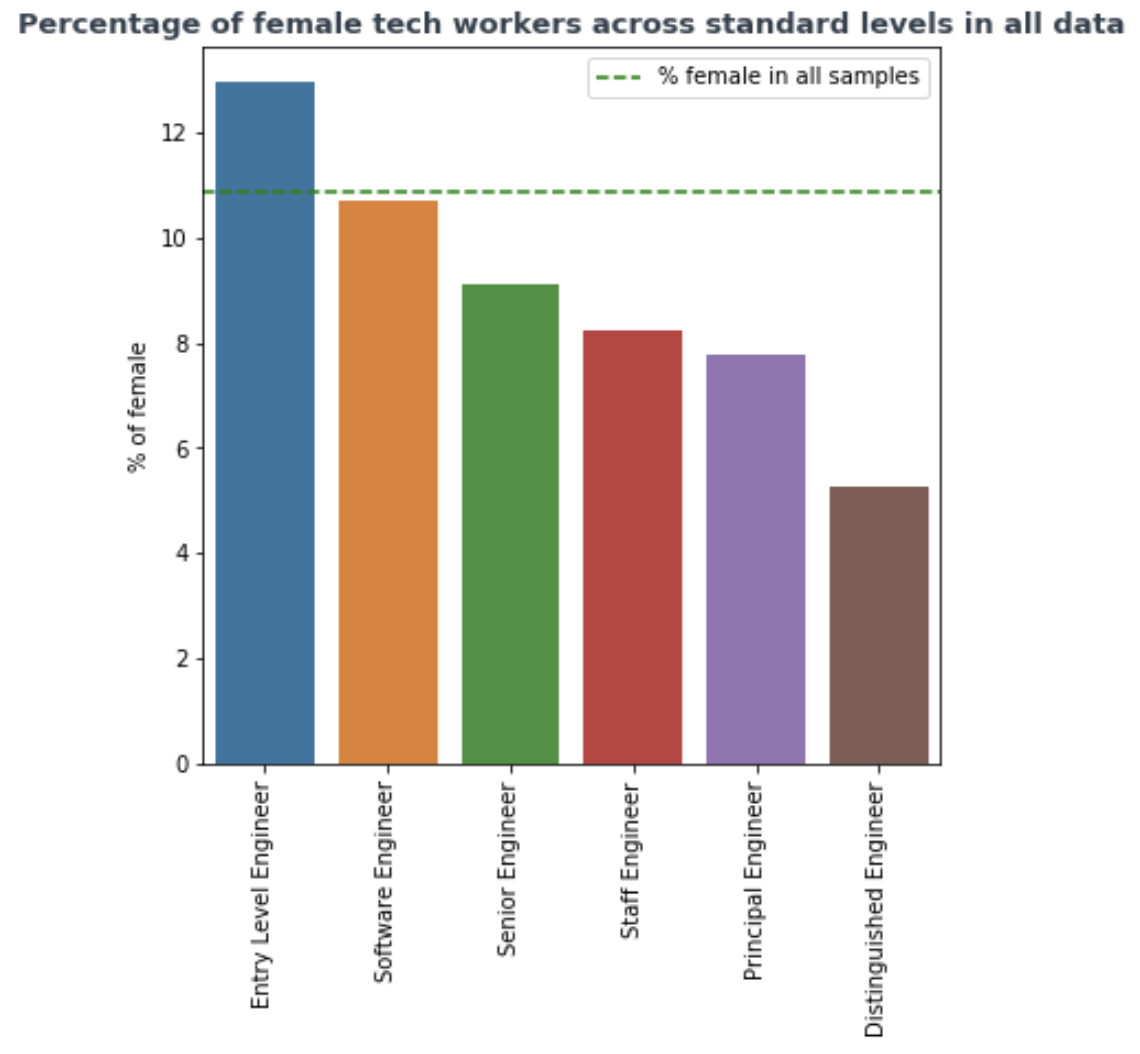
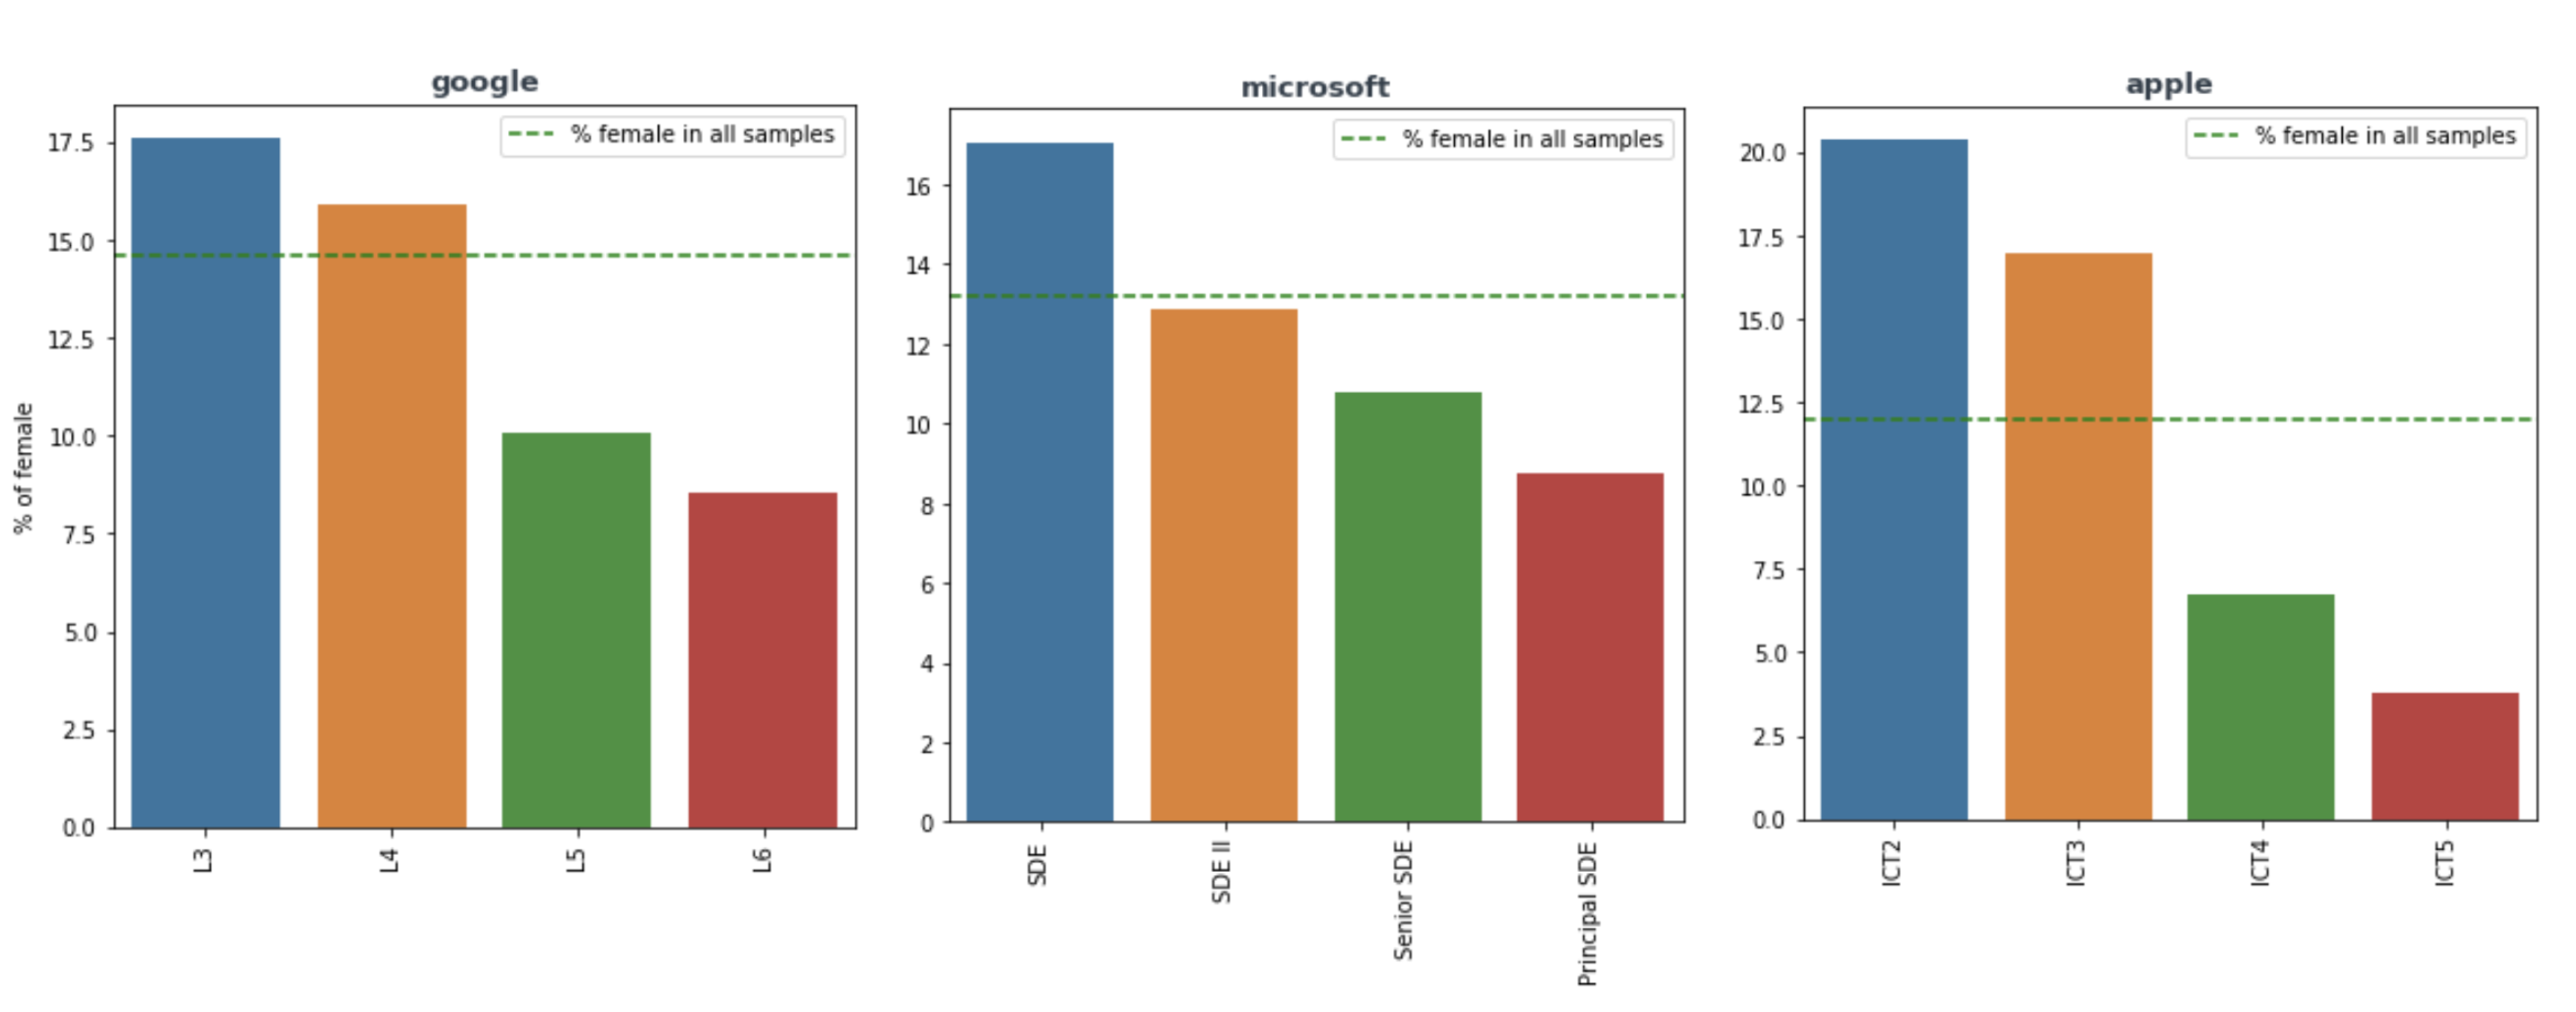
2.2 As level increases, the percentage of female software engineers decreases
Both at standard levels across all companies, and within each major company. This is consistent with the known women’s leadership gap, both in tech and out of tech [1, 2].
Three hypotheses:
- Because of the ceiling, it’s harder for women to be promoted.
- Women leave tech before they get promoted. According to a research by the Center for Work-Life Policy study, more than half of women in tech leave the industry by the mid-point of their career, which is more than double the rate of men. Indeed surveyed 1,000 women in the field and found that the main reasons women leave tech are: advancement opportunities, wage disparity, and work-life balance.
- Because more women entered tech recently, there are more women at lower levels.
3. Compensation analysis
The compensations of tech workers follow a skew normal distribution with a small percentage making an outlier amount of money: e.g. tech workers in India or Russia can make under $20k, while top engineers at Google, Facebook, OpenAI can make millions a year.
Each compensation package consists of 3 components:
- base salary
- equity (stock)
- bonus
3.1 Distribution of Total Yearly Compensation
The median yearly compensation is $195,000, while the mean is $225,000.
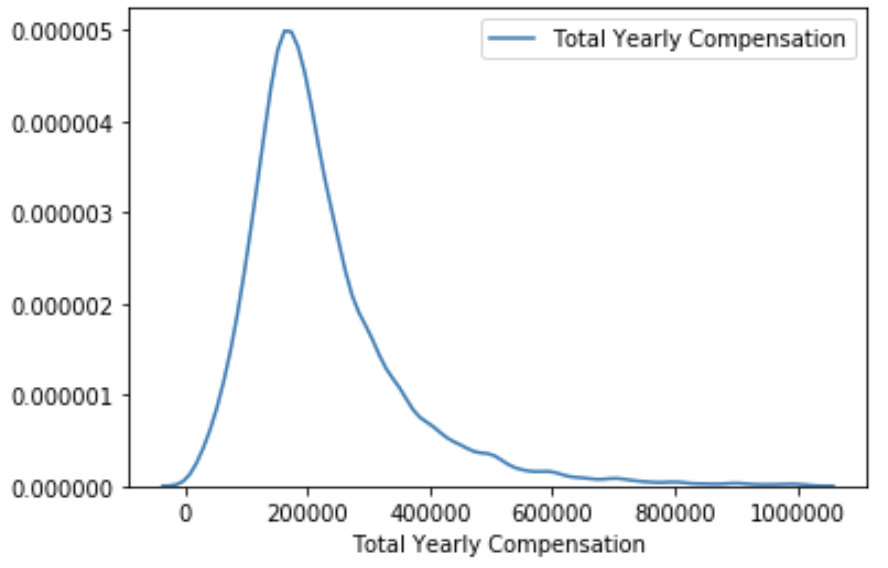
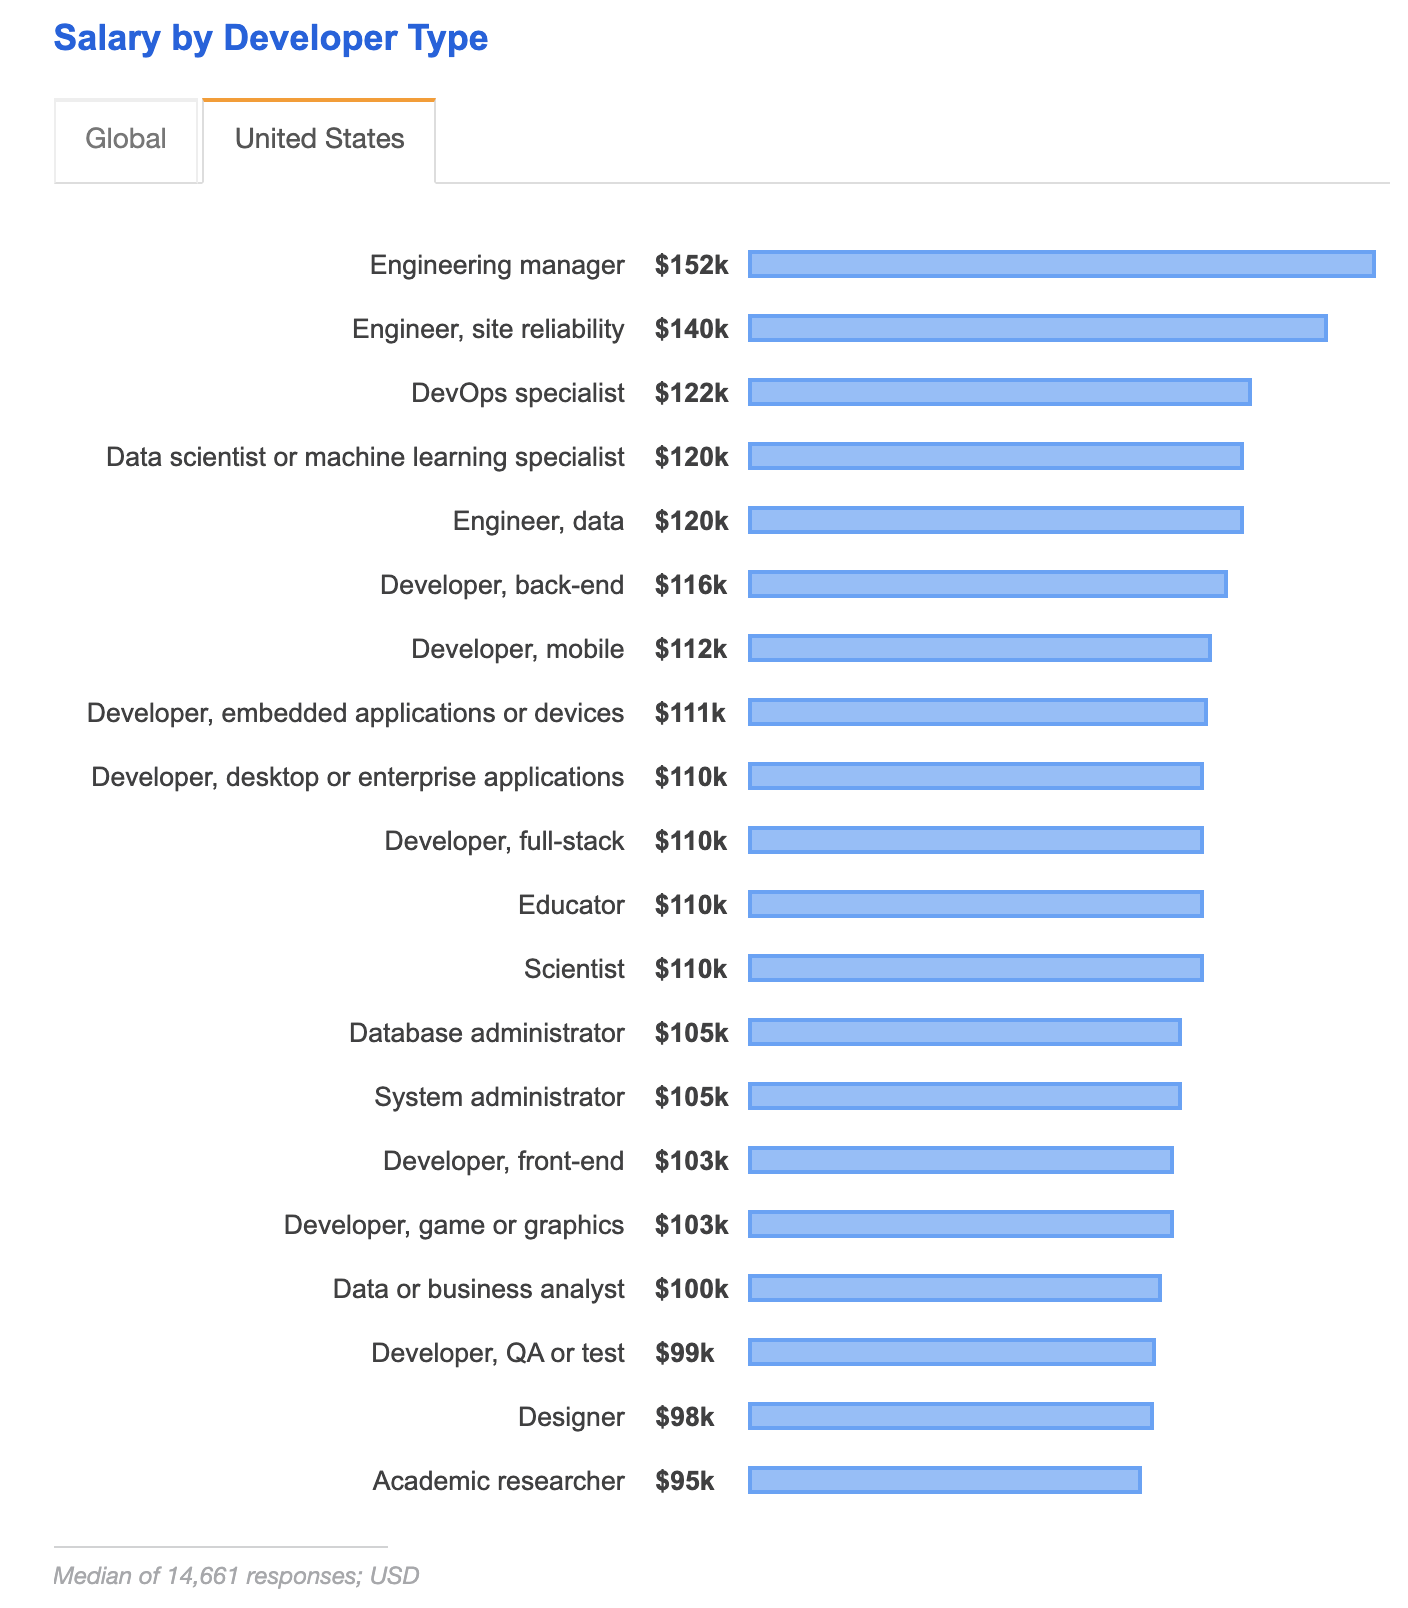
This is significantly higher than the results of the StackOverflow survey in 2019, which states that the median salary for Engineering Manager in the US is only $152,000. This might be because of the differences between StackOverflow data and Levels.fyi data:
- StackOverflow data is smaller (14.7k samples)
- StackOverflow data is more fragmented with respondents from all over the world while Levels.fyi data is more US/FAAAM-focused.
- StackOverflow surveyed salary, while Levels.fyi asks for the whole compensation package, which includes base salary, stock grants, and bonus.
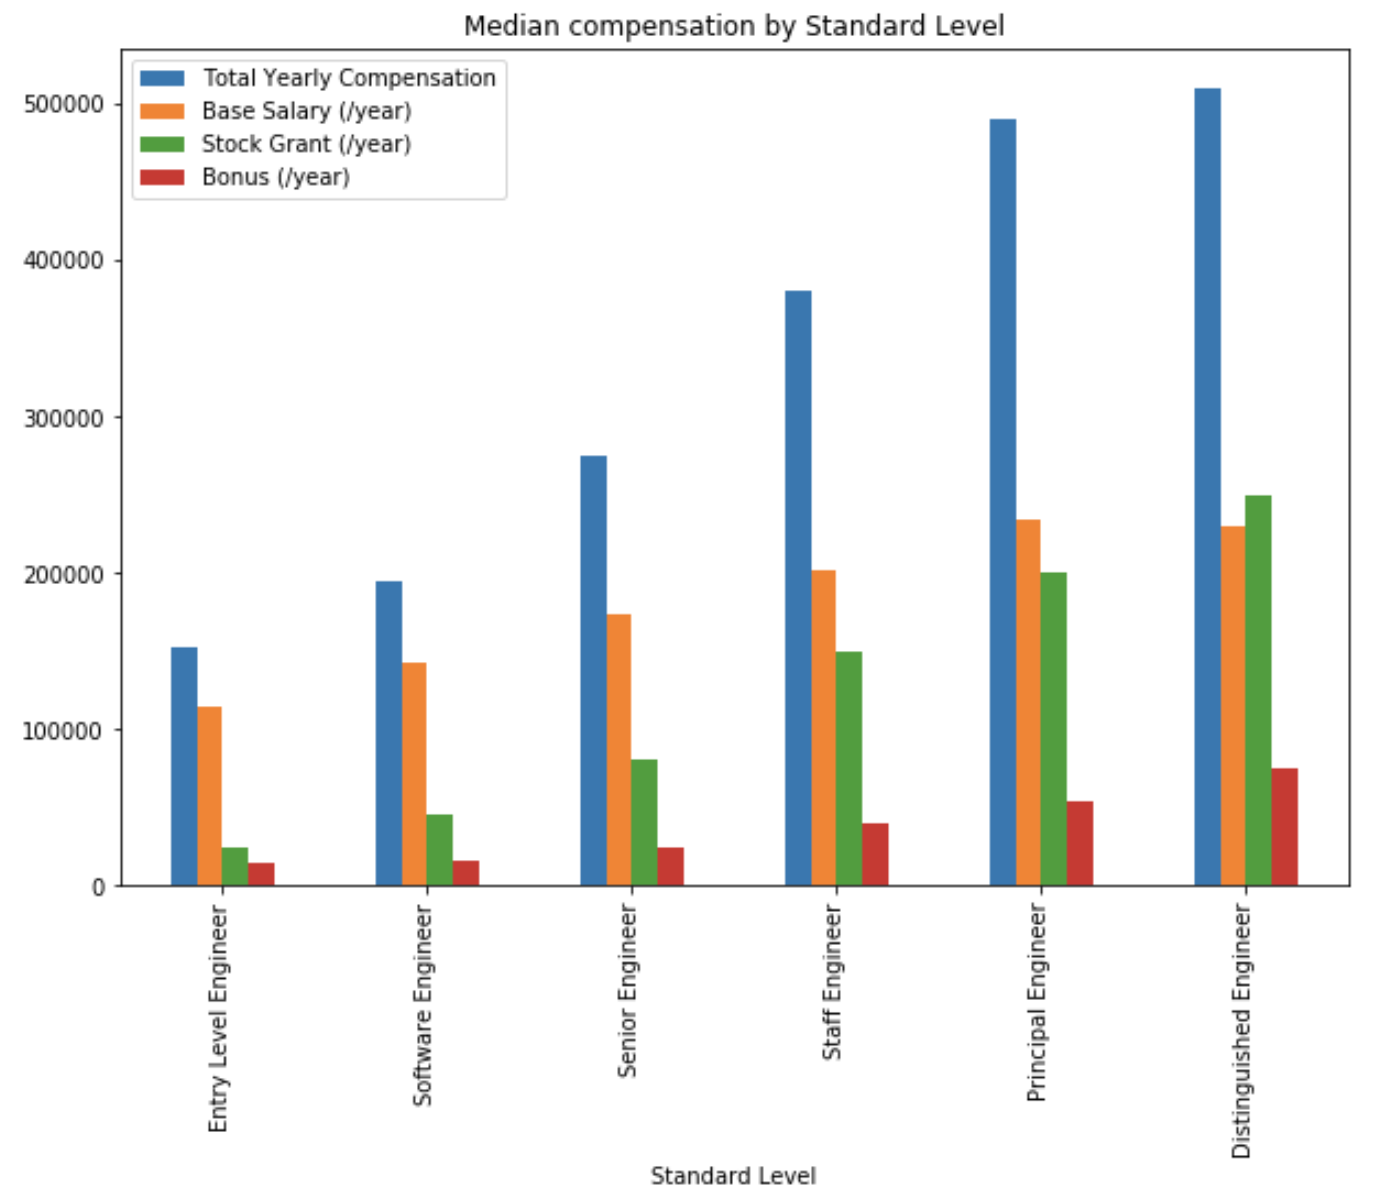
3.2 Total Yearly Compensation by Standard Level
As level increases, base salary and bonus increase little, but stock grants increases the most.
Stock grant is often vested over 4 years – if you’re granted 100 shares, then each year 25 shares are vested. Your stock grant is usually refreshed with new shares each year. After your first year, you’re grant 100 extra shares, so next year you can vest 25 old shares + 25 new shares = 50 shares. The longer you stay at a company, the more stock you have left to vest. This structure of compensation is to incentivize employees to stay longer at the company.
Tip: when negotiating with big companies, it’s harder to make substantial change to the base salary offer than to improve the stock grant and bonus offers.
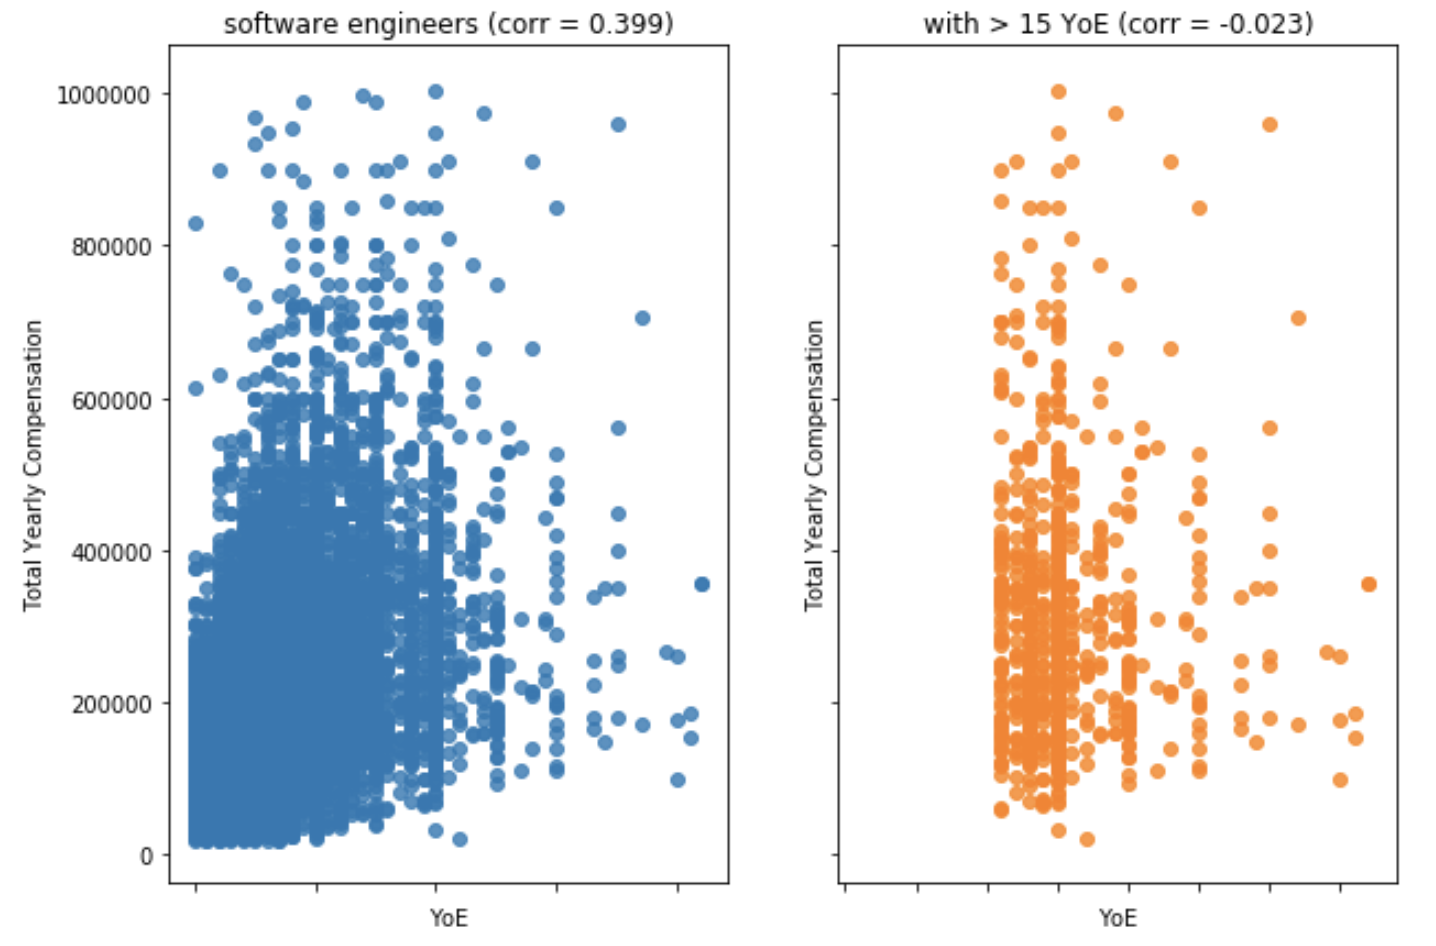
3.3 Compensation by Years of Experience
There’s a medium correlation between income and years of experience. The correlation is stronger for people early in their careers. As you gain more years of experience, your compensation generally improves, until you reach 18 years of experience. The median compensation for those with more than 18 years of experience is actually lower for those with less than 18 years of experience.
For tech workers – software engineers, hardware engineers, and product managers – with more than 15 years of experience, the correlation regresses to slightly below 0.
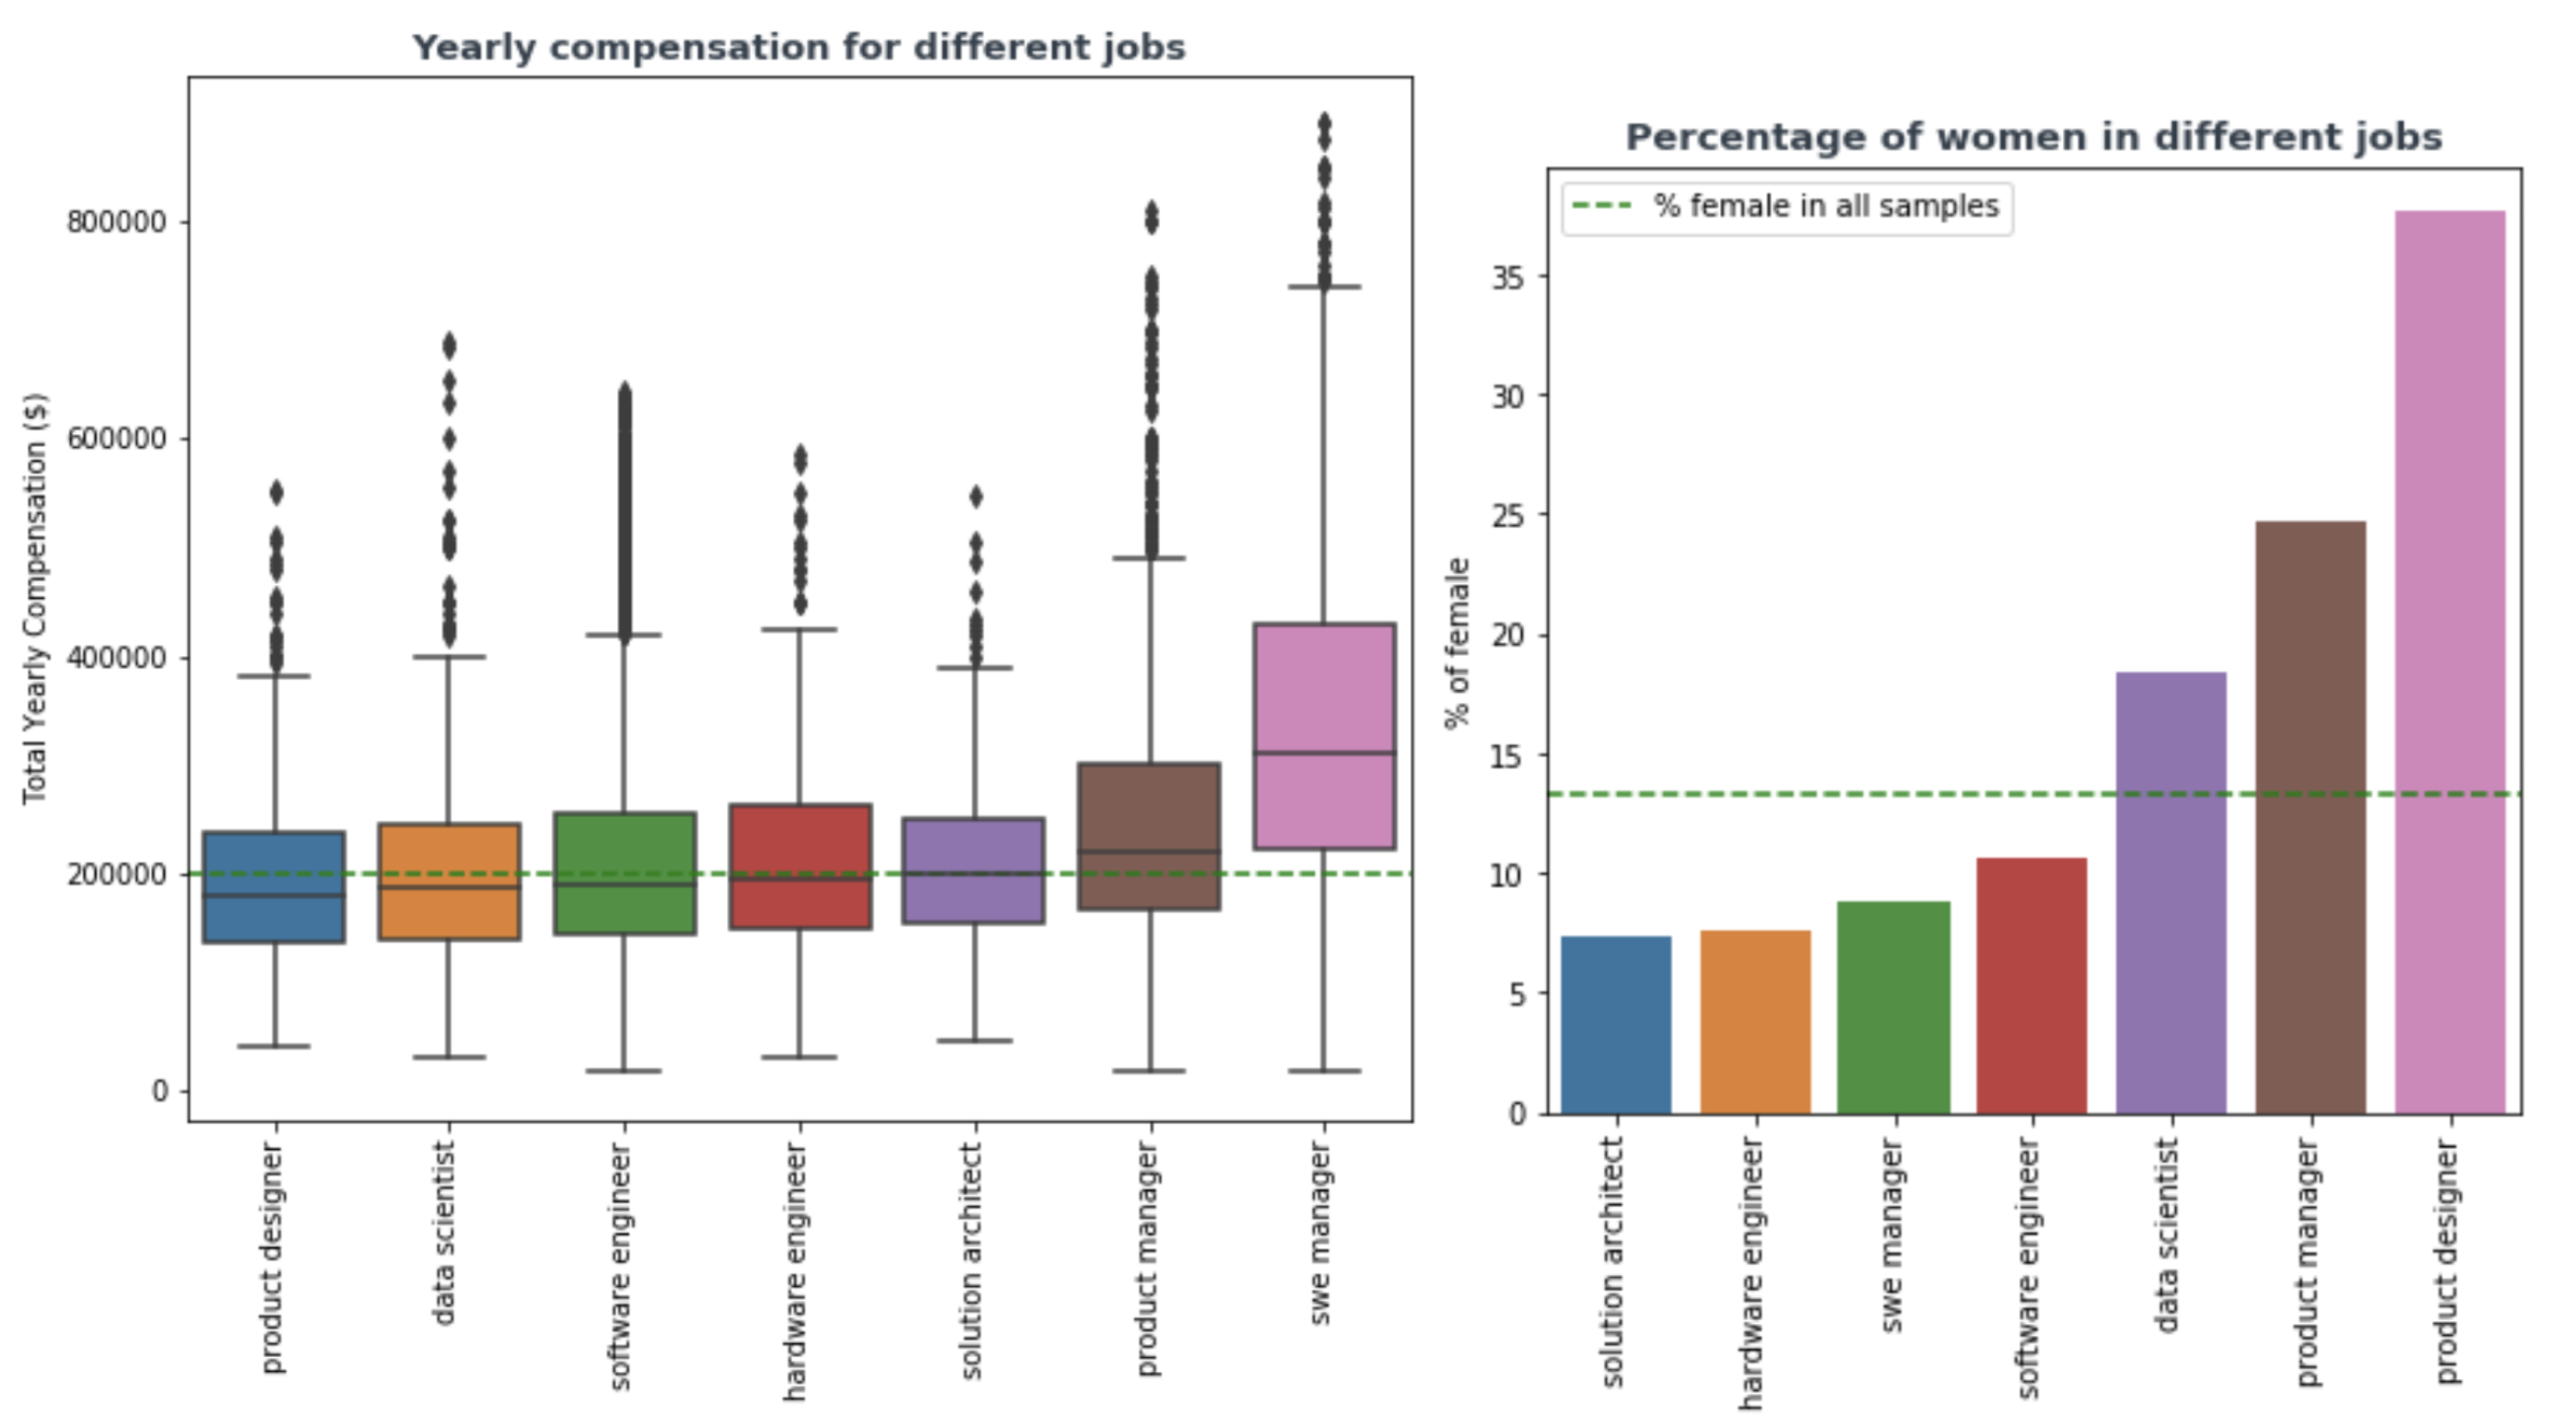
3.4 Compensation by job
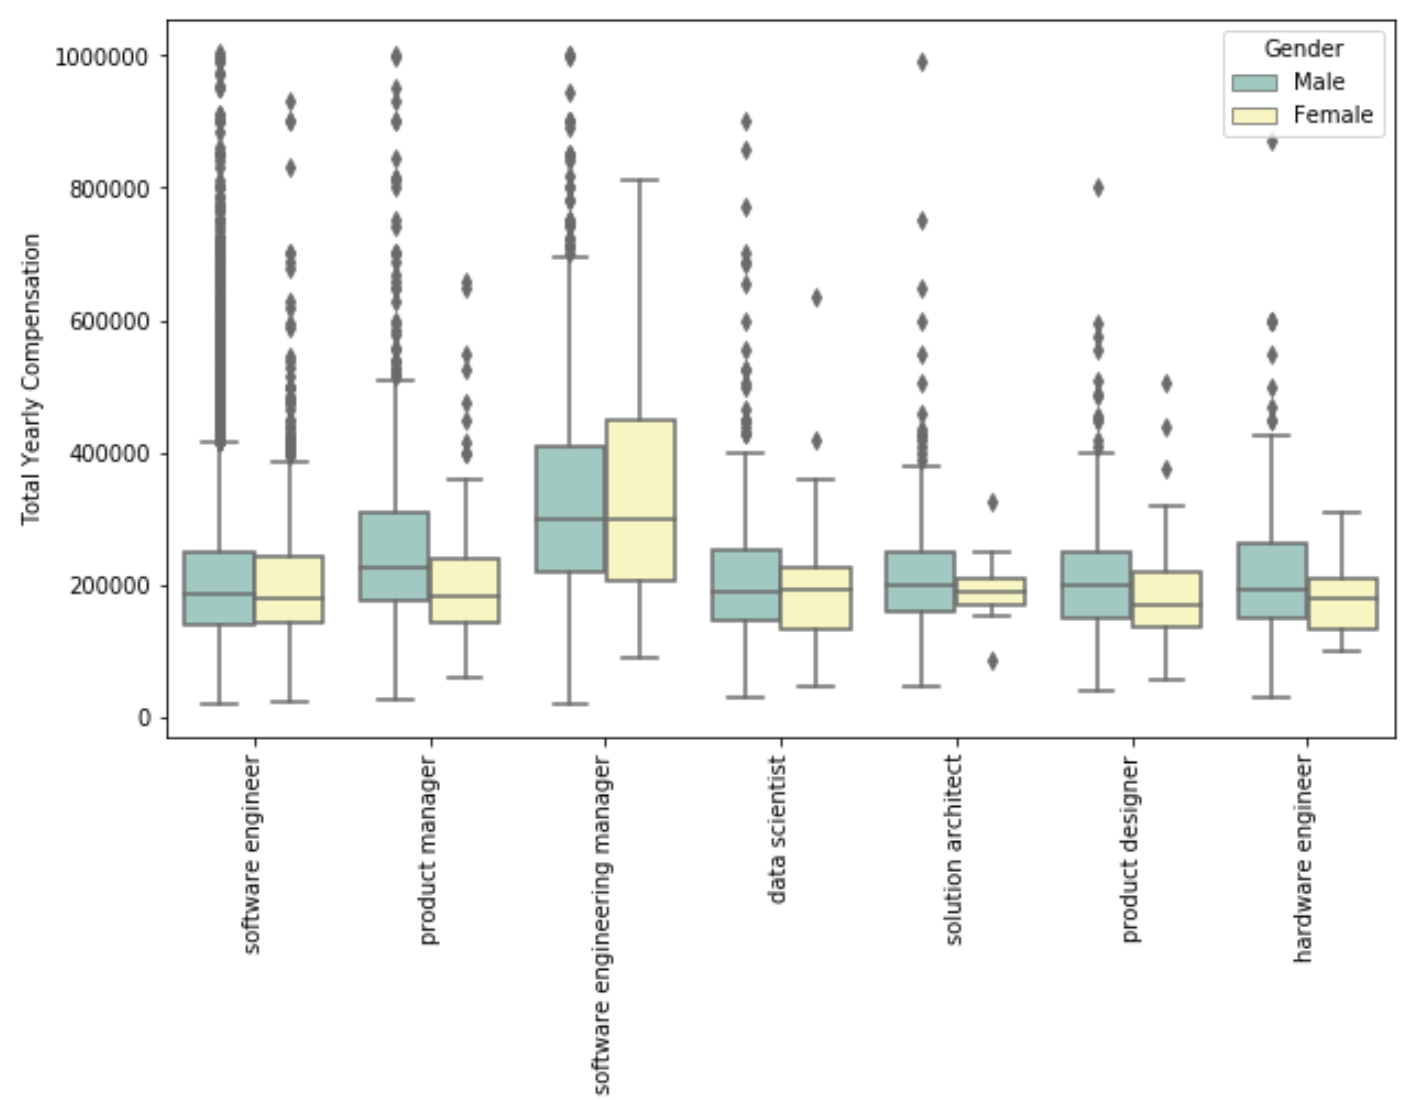
For each job that has at least 350 entries, the median ranges between 180k to 320k. It’s not surprising that SWE manager has the highest median. There’s also a very low percentage of women in SWE Manager (8.75%).
The job with the lowest median income, product designer, coincidentally also has the highest percentage of women.
4. Compensation by gender
4.1 In all data
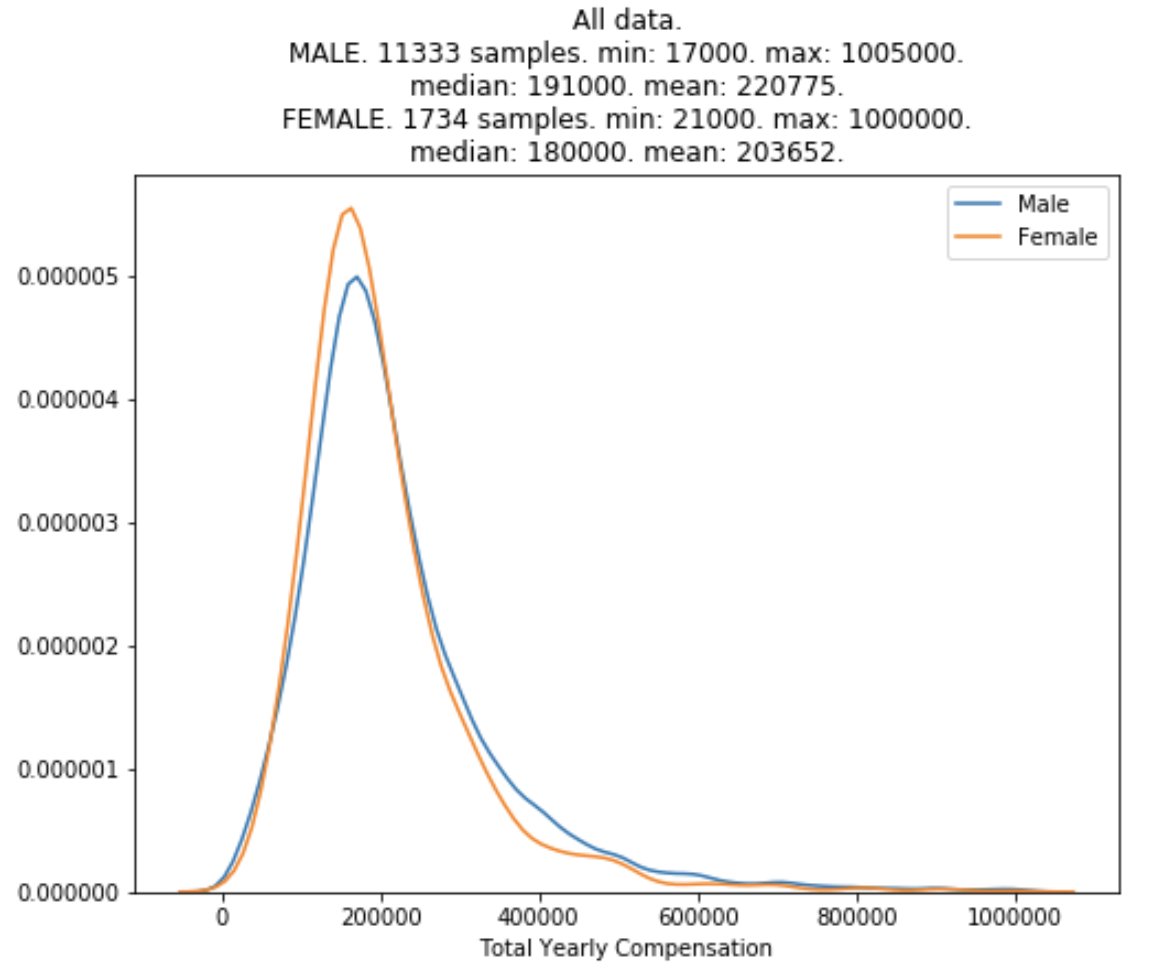
The distributions of income for men and women in the entire dataset – across all companies, all locations, all levels, all jobs – match each other surprisingly well.
Among all those report their incomes here, the median for male is $11k (6%) higher than that for female. It’s due to more male engineers at the right tail of the distribution (higher compensation).
4.2 By job
The median compensation of women is slightly lower than the median compensation for men for most jobs, except for the role of Data Scientist and Software Engineering Manager.
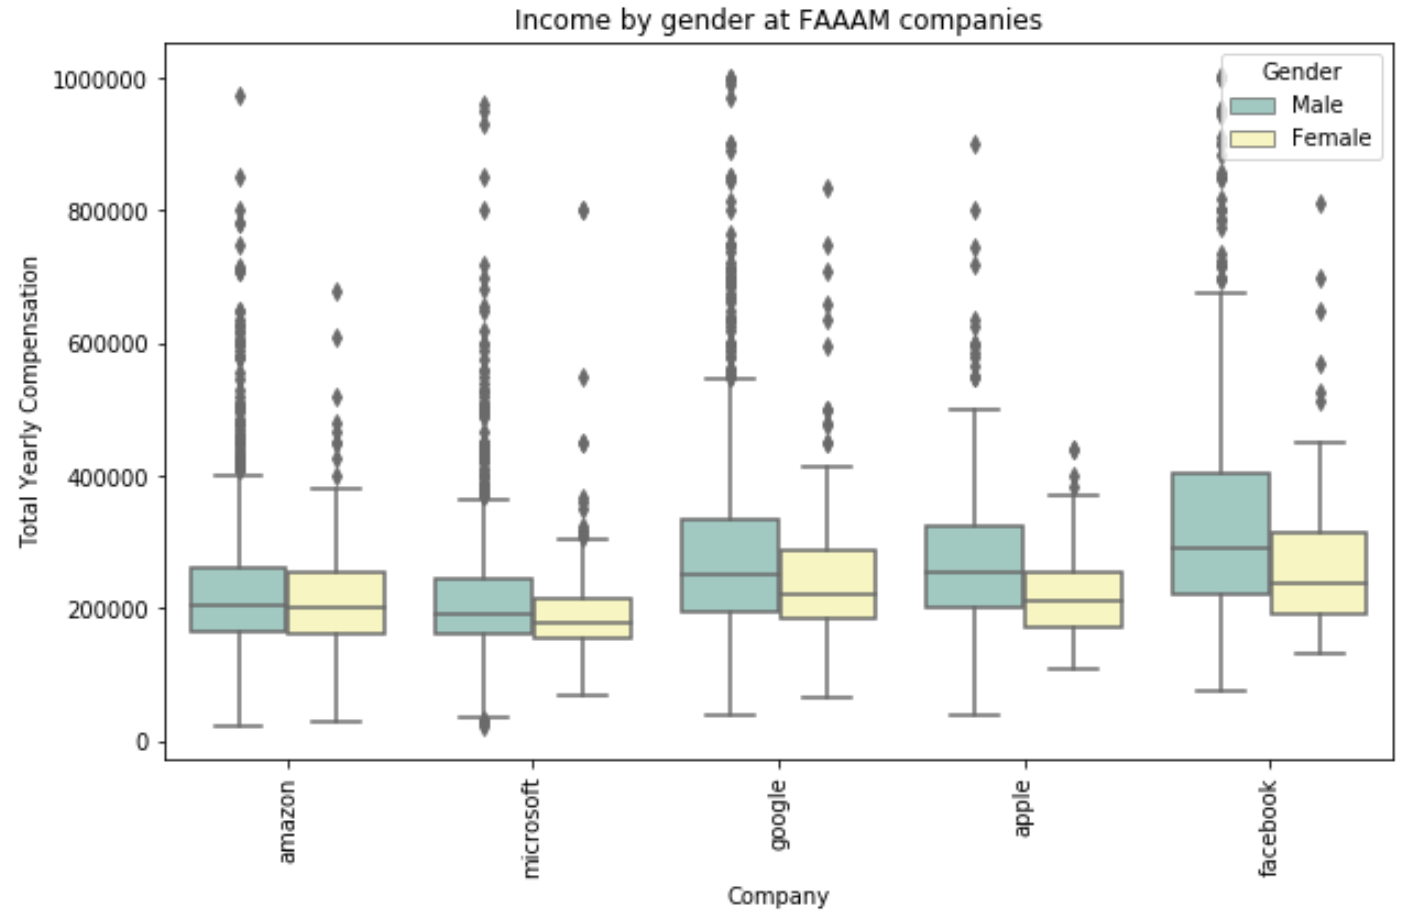
4.3 By company
The median income of women is less than that of men in all FAAAM companies.
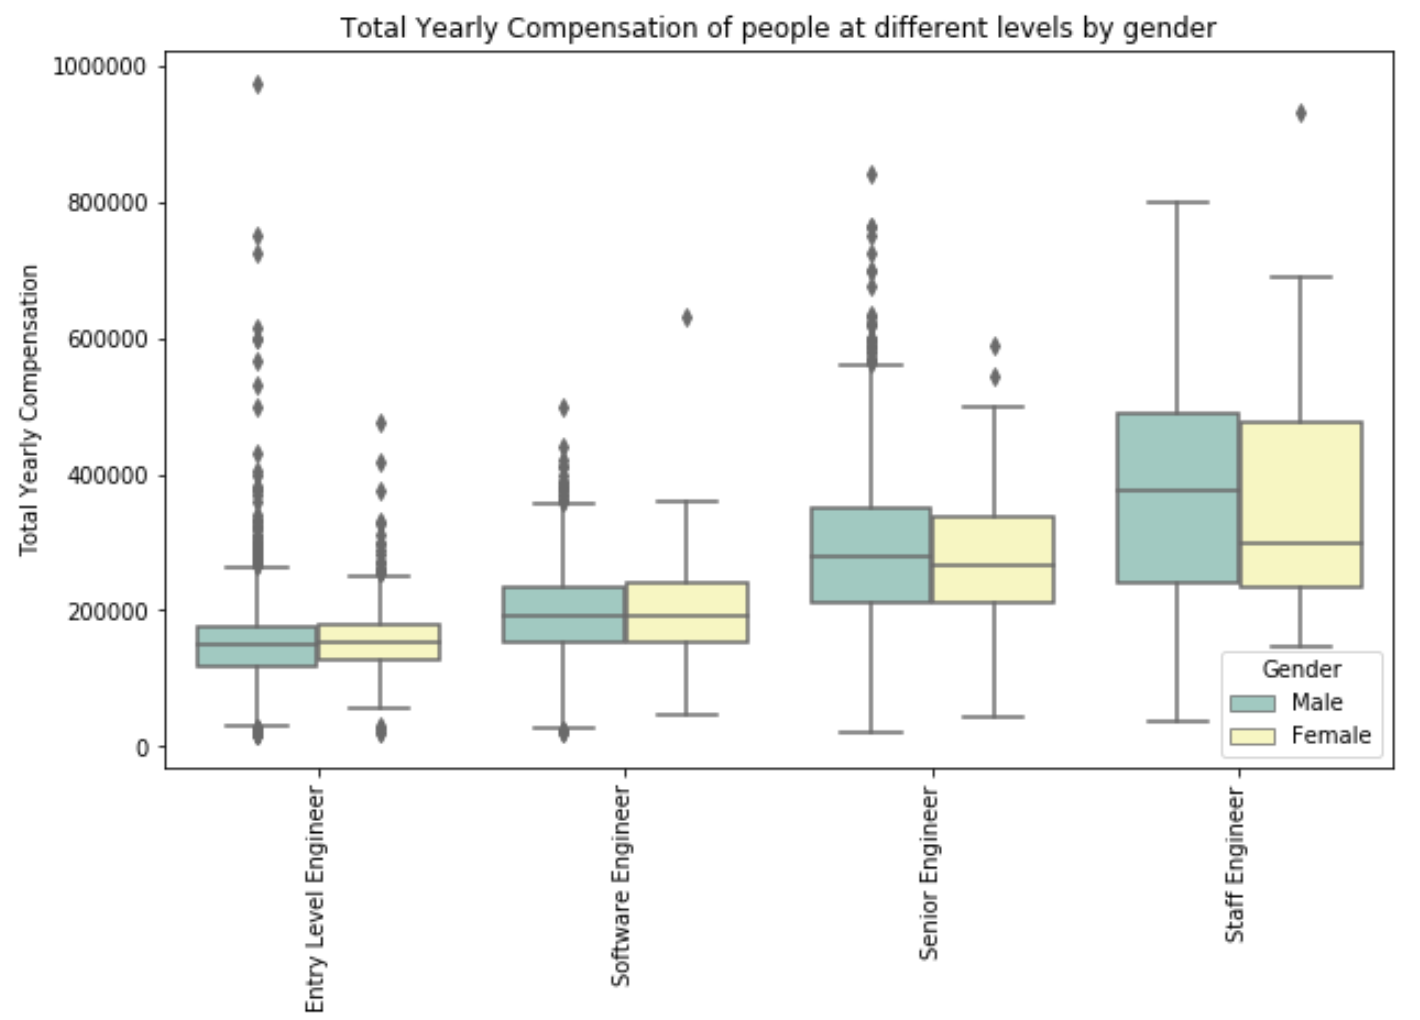
4.4 By standard level
There’s virtually no difference in compensation between men and women at Entry Level Engineer and Software Engineer. However, as the standard level increases, the percentage of women decreases and the compensation gap widens. This might be because at entry levels, women and men are both given standard offers. As levels increase, pay raises require negotiation and according to research, when it comes to negotiating salaries, women are less assertive than men.
I’d also like to restate the disclaimer: just because there’s no evidence in the data to support something, doesn’t mean that something doesn’t exist.
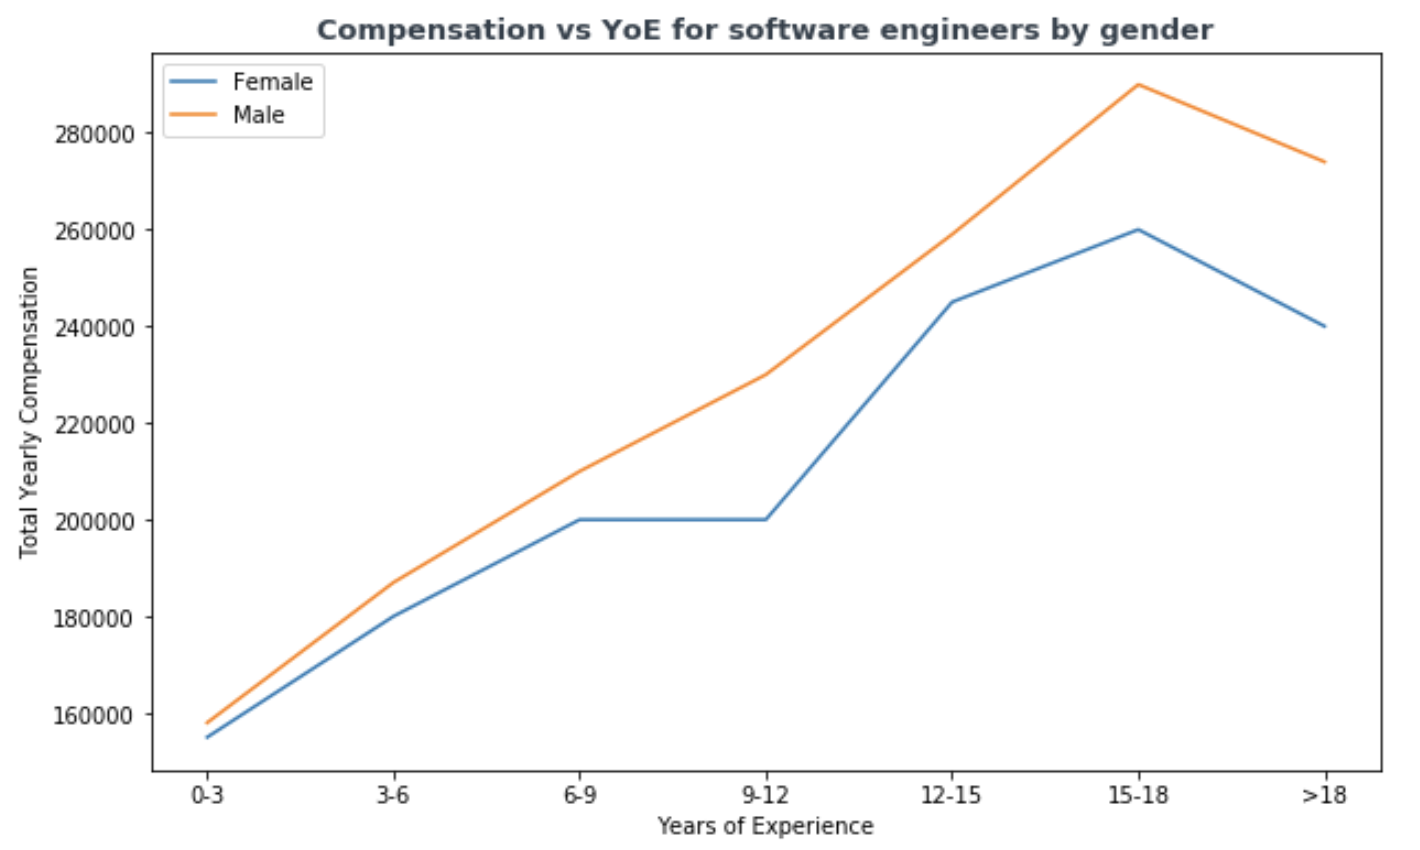
4.5 By years of experience
There’s virtually no difference in compensation between men and women at for those with less than 3 years of experience. The gap starts appearing later.
4.6 Income by gender for those of the same level, same company, same state, same job
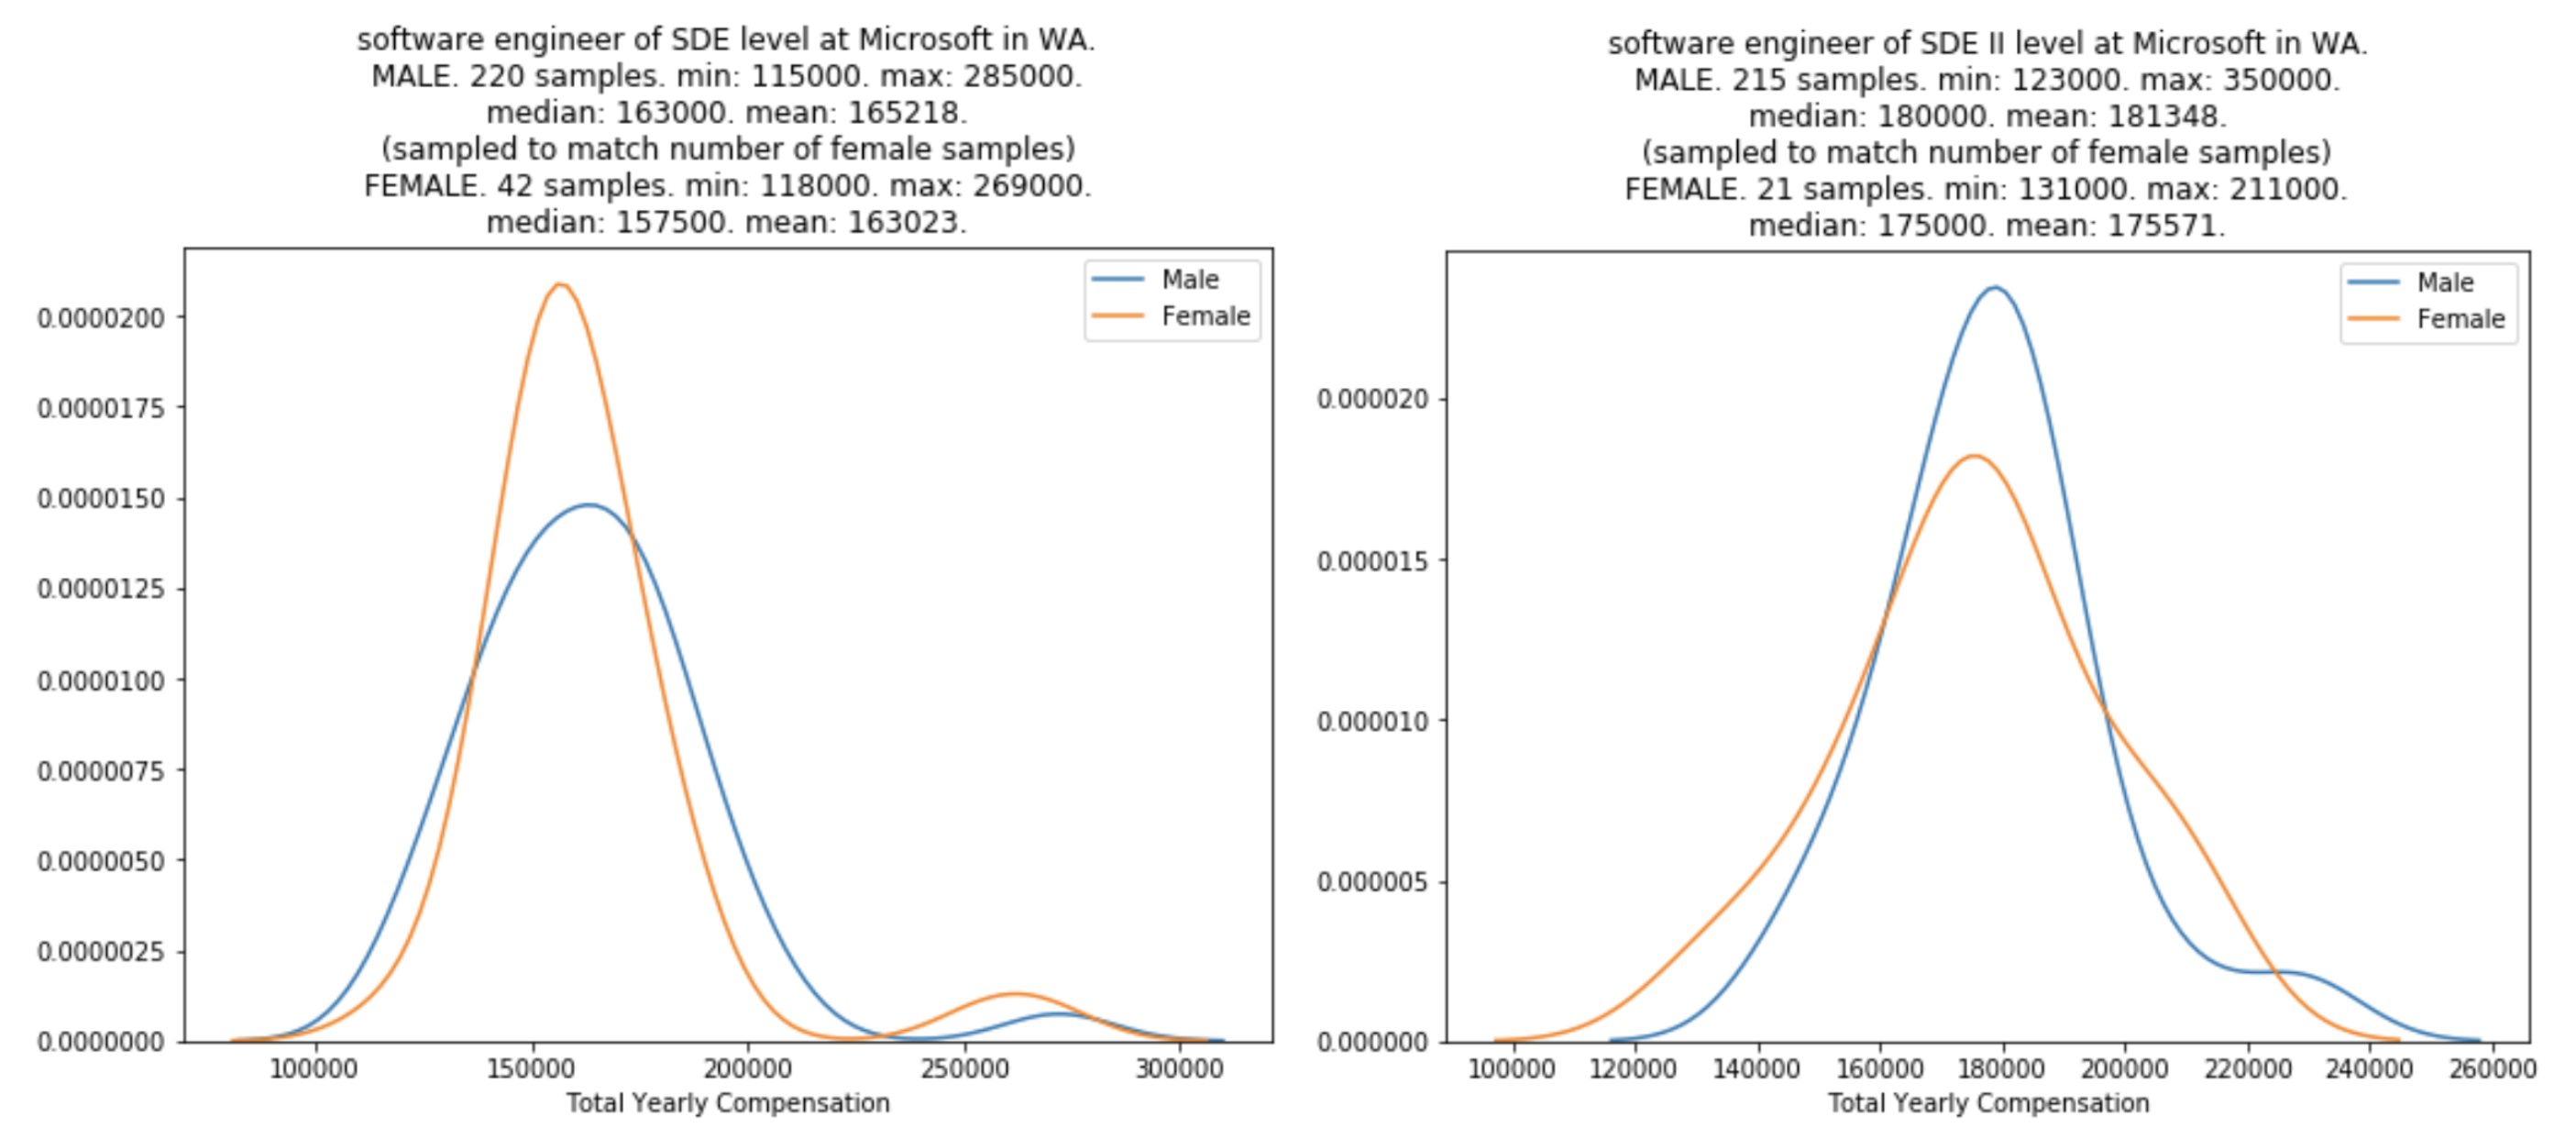
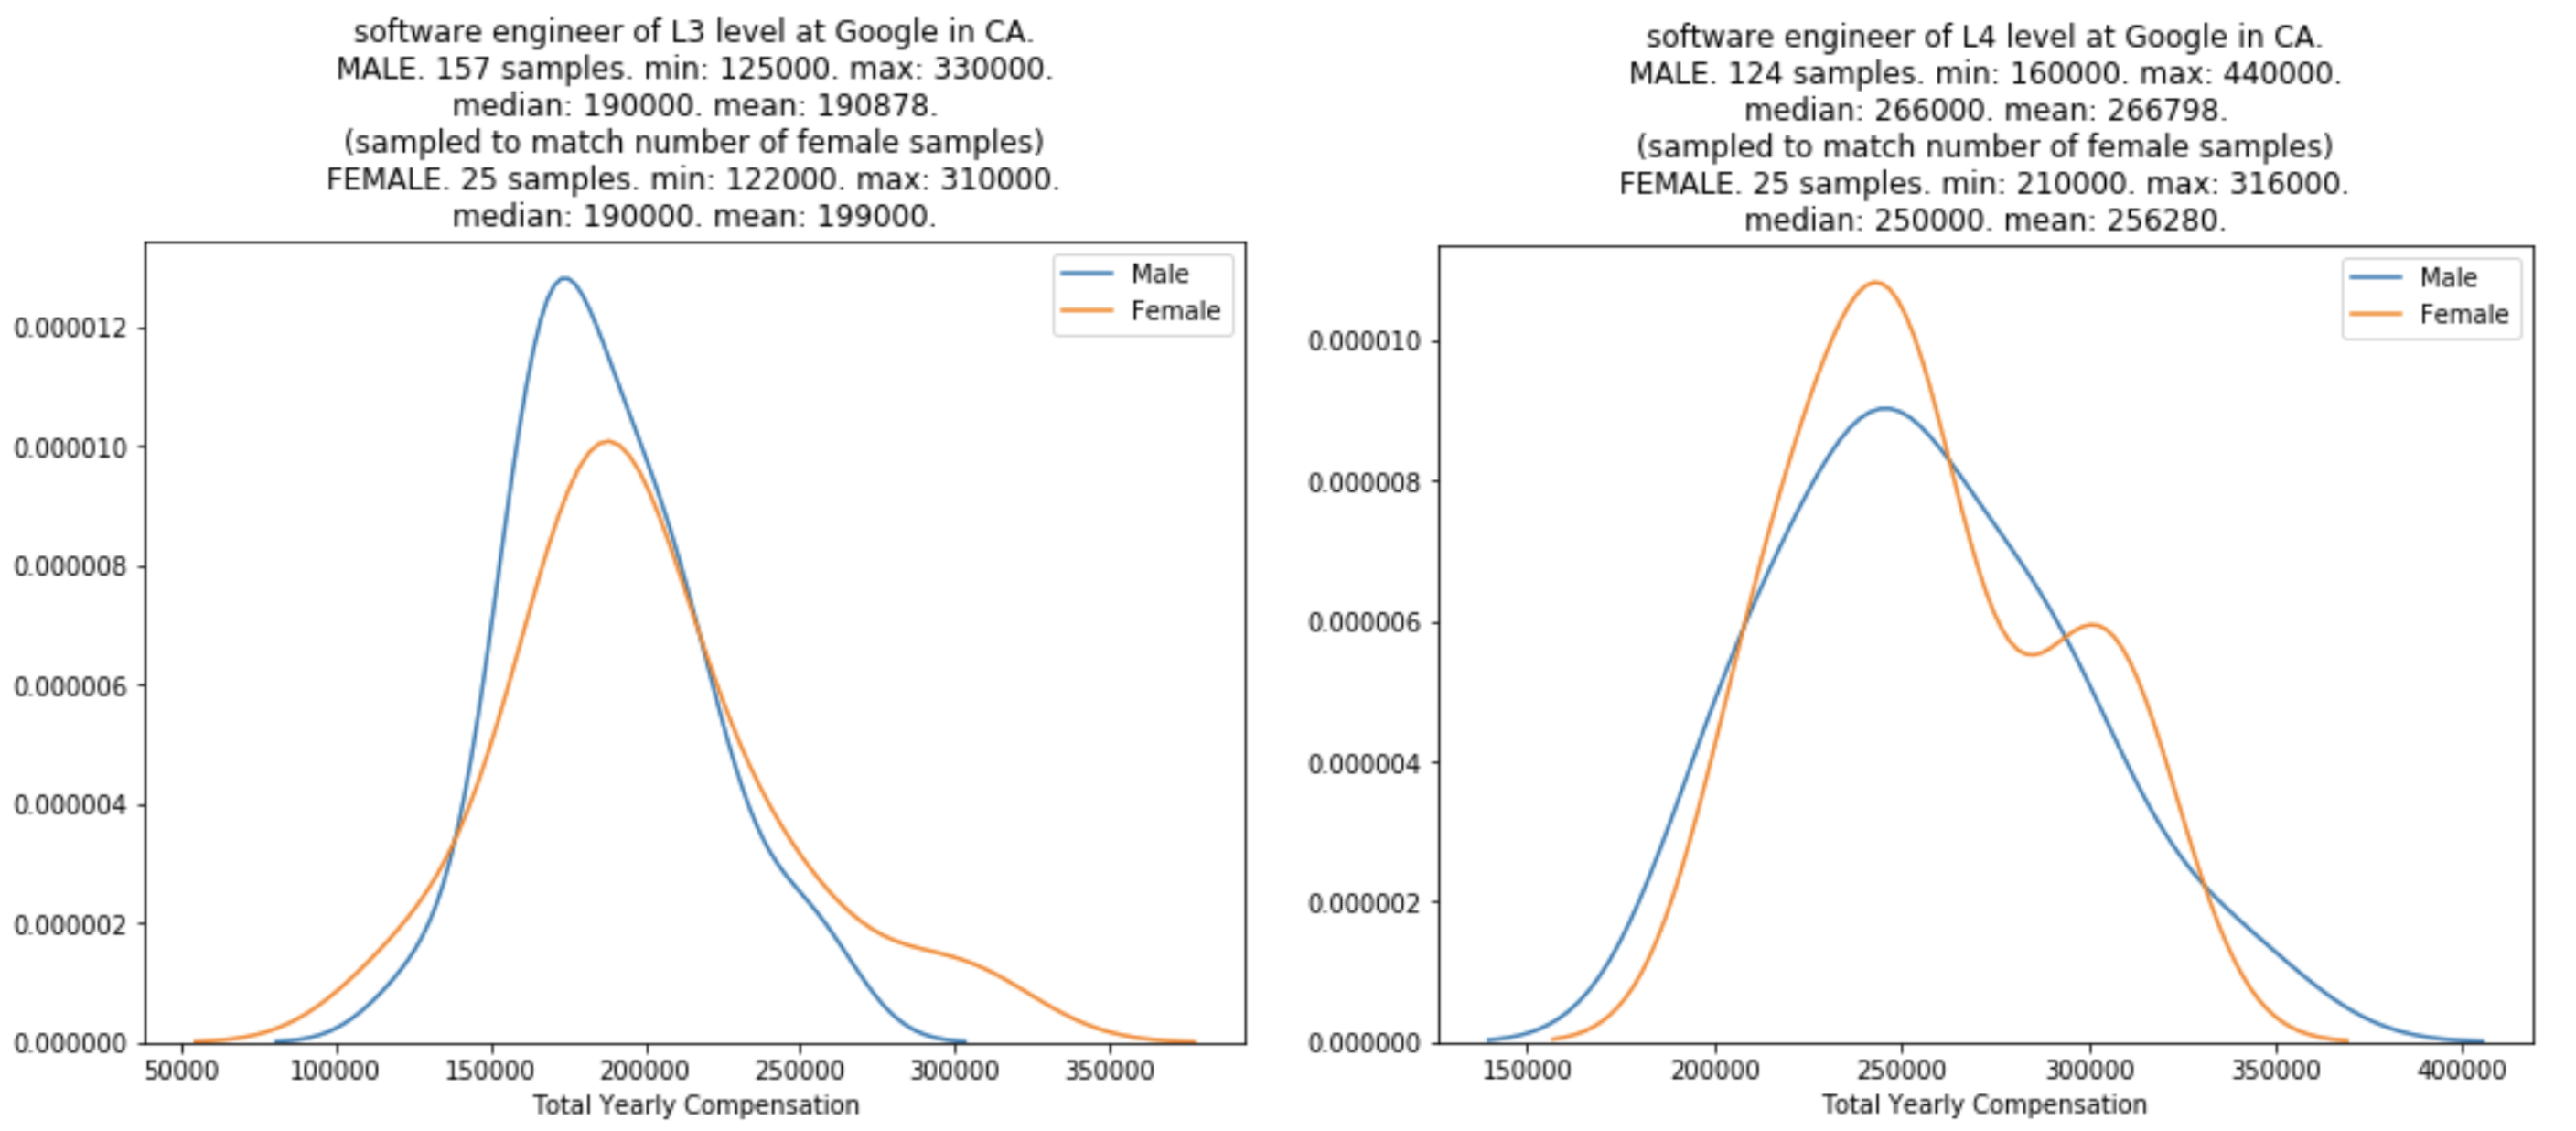
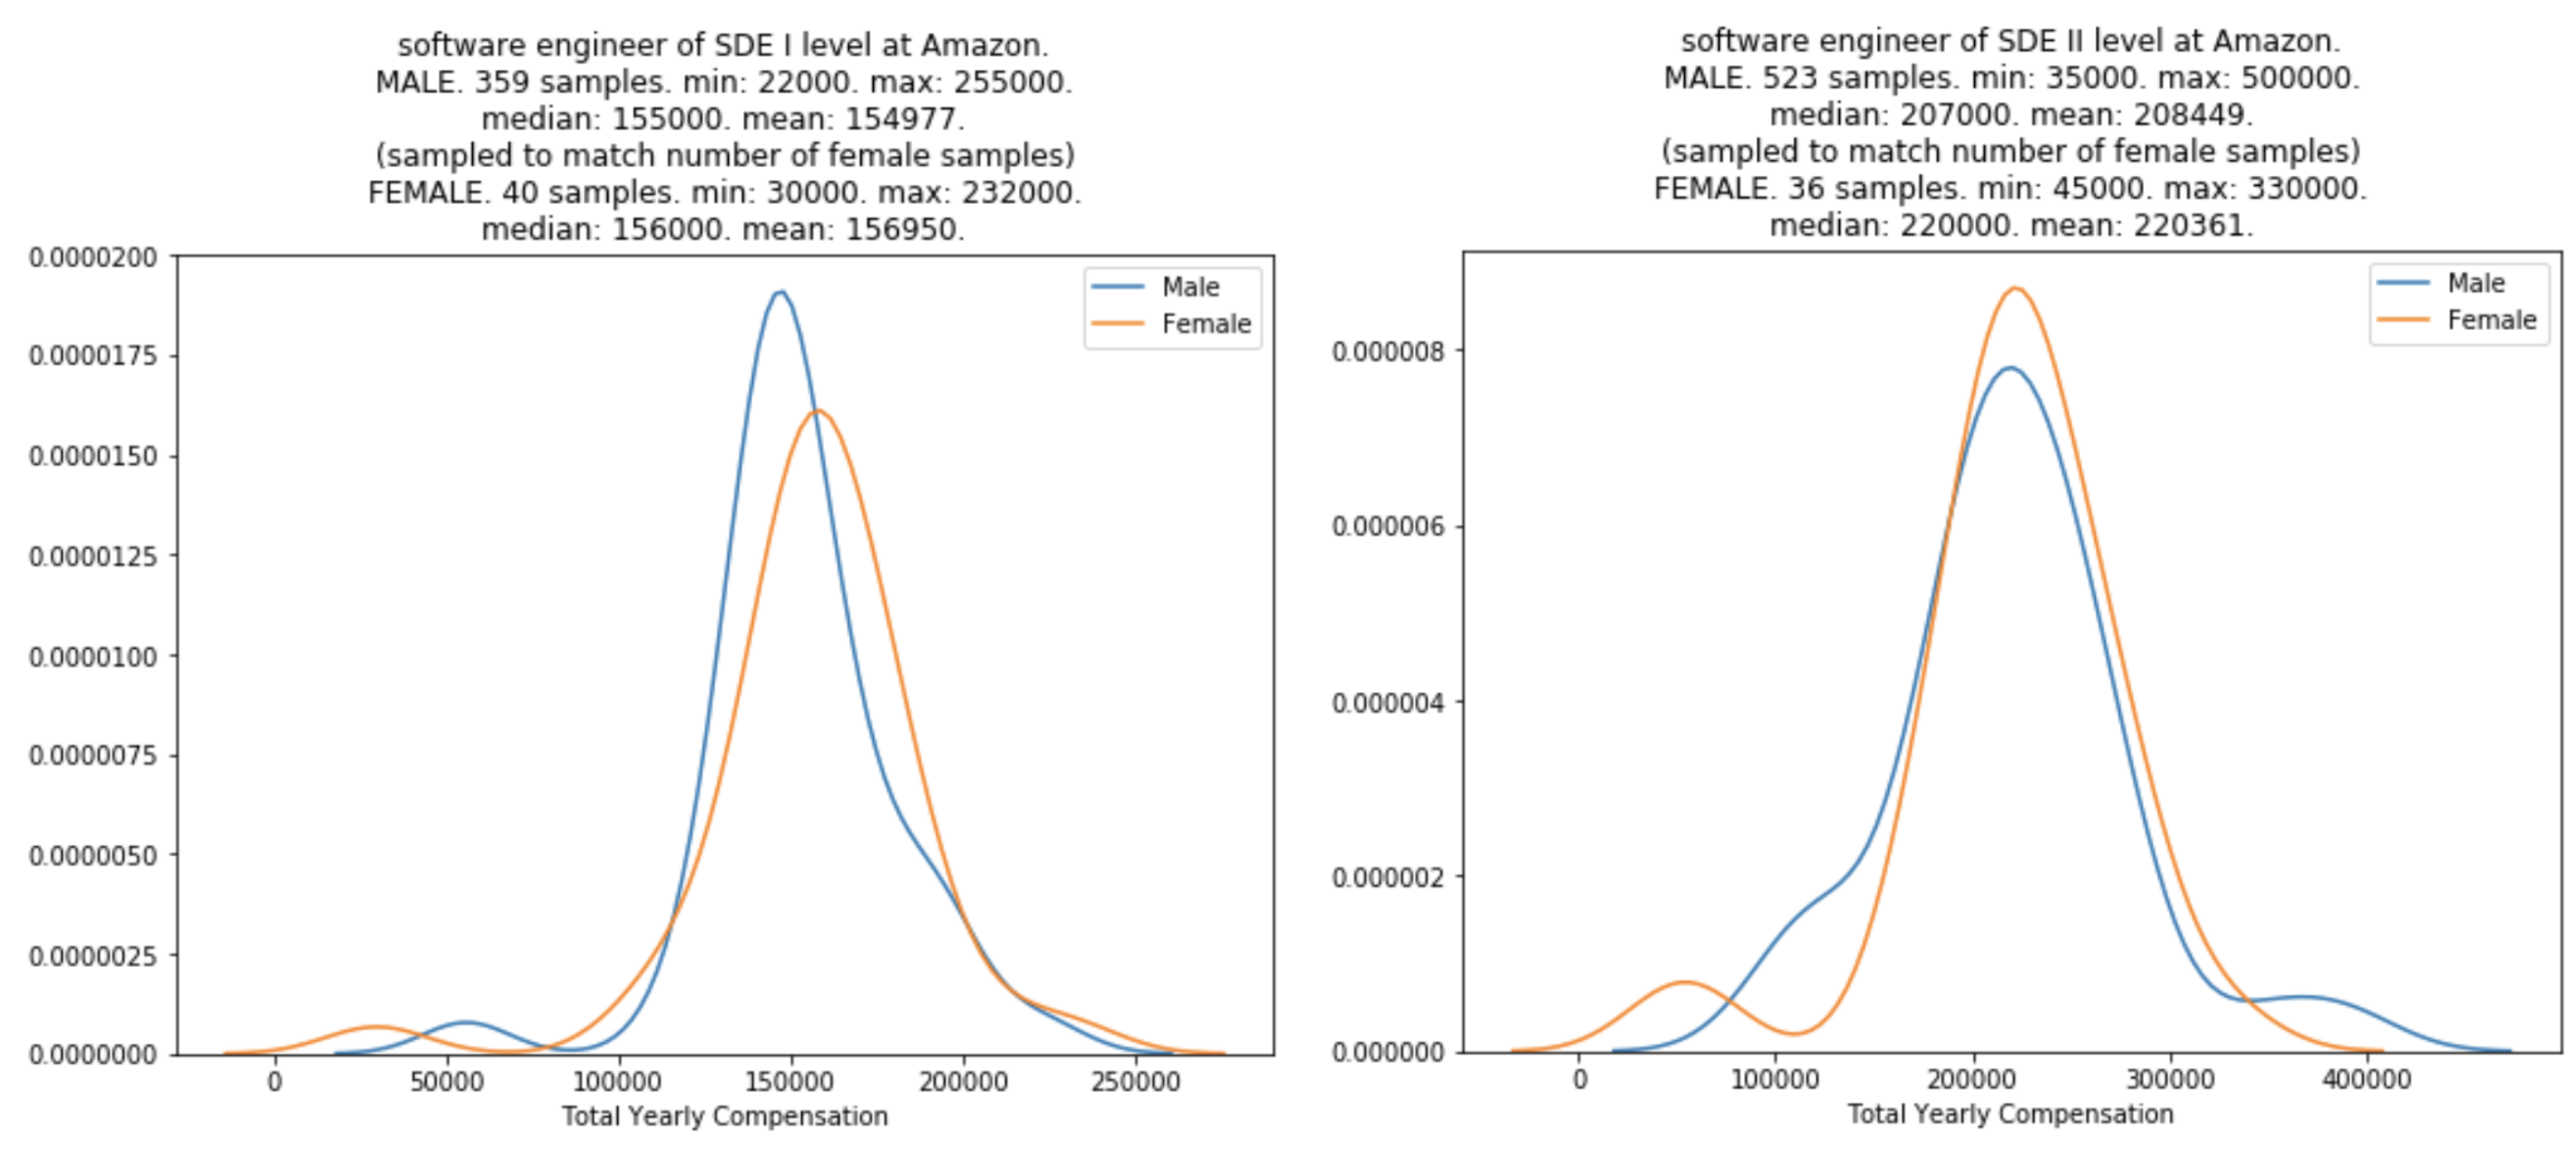
When controlled by all the above variables, there’s virtually no difference in compensations at the entrance level for software engineers at the big companies that we analyzed. In the case of Amazon, the median of compensation for female engineers at SDE and SDE II is actually higher than that for male engineers at the same level.
The gap might start appearing after the first two levels. However, we don’t have enough data for female samples to make any meaningful visualization.
Due to the small number of female samples, we sample without replacement from male samples so that we have the same number of samples for men and women.
4.6.1 Software Engineers at Microsoft in Washington
We only analyze SDE and SDE II, the first two levels at Microsoft, because we don’t have enough female samples for higher levels.
4.6.2 Software Engineers at Google in California
We only analyze L3 and L4, the first two levels at Google, because we don’t have enough female samples for higher levels.
4.6.3 Software Engineers at Amazon in both California and Washington
We only analyze SDE I and SDE II, the first two levels at Amazon, because we don’t have enough female samples for higher levels. We use two states instead of one because one doesn’t give us enough data.
5. Conclusion
Some key points:
- The median compensation for software engineers in our data (skewed towards FAAAM, CA/WA-based) starts at around $160k/year for entry level, and reaches around half a million.
- As level increases, the percentage of women decreases both across companies and in each FAAAM company.
- Our data shows that at entry level, there’s virtually no difference between the compensation of men and women. The gap starts appearing only as the level progresses.
- Tech favors the young. For people with more than 15 years of experience, there’s practically no correlation between years of experience and income (corr < 0). After 15 years of experience, you either retire, switch to management, or change career.
I hope that this analysis can guide people in making important career decisions. I don’t wish to make people look at this analysis and compare themselves to the median or whatever statistics there is. Each of us is more than a statistics. Everyone has their own struggle. The average person doesn’t exist.
I also hope that big companies would start publishing analysis of their internal data for transparency, so that we don’t have to rely on anonymous, self-reported data to answer these important questions.
Acknowledgment
I’d like to thank Zaheer Mohiuddin, Bruno Faviero, Andrey Kurenkov, and Paul Marum for giving me helpful feedback. They, however, aren’t responsible for any error that might exist in this piece.
This analysis was done as part of the research for my upcoming Machine Learning Interviews Book.